
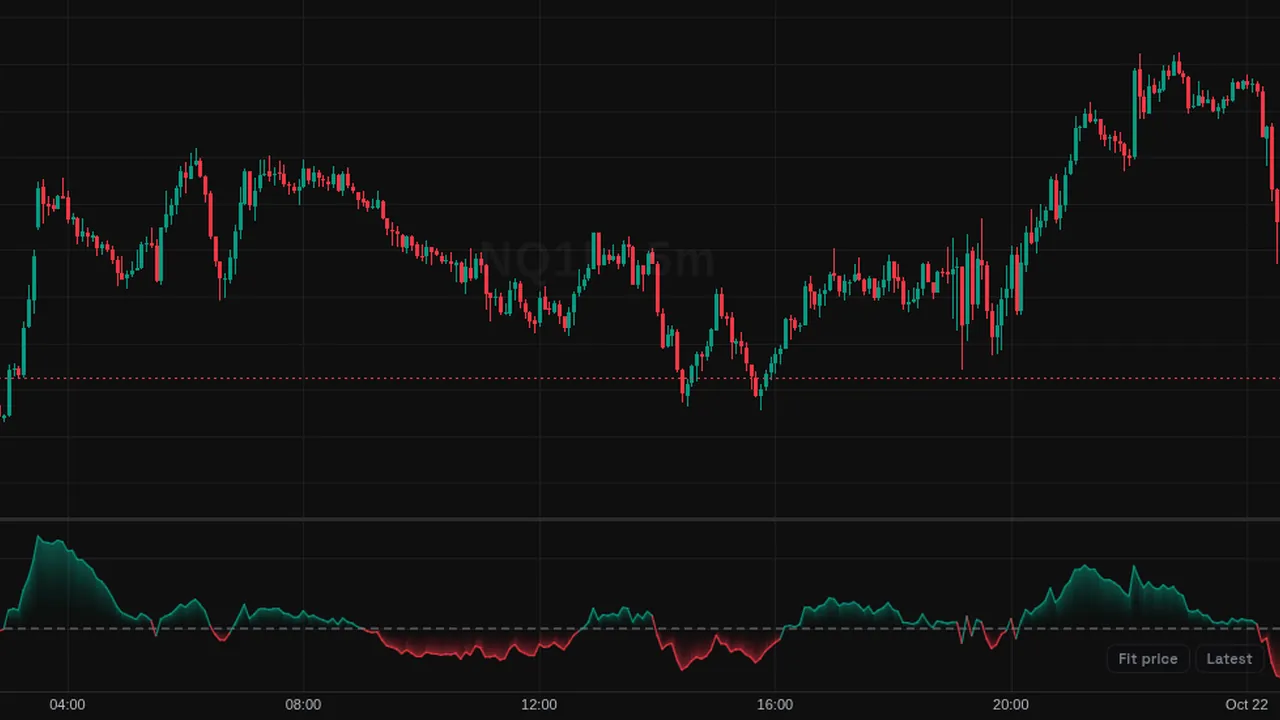
Detrended Price Oscillator: price minus a shifted 21-bar average, to show short cycles without the trend.
Overview
The Detrended Price Oscillator (DPO) removes the longer trend so you can see shorter cycles. It plots in its own pane around zero, green above and red below.
With Centered on, the line is shifted back so it lines up with the prices it measures.
How it works
DPO = source - SMA(source, 21) taken from 21 / 2 + 1 bars earlier. In centered mode the line is moved back by that many bars, so the newest bars show no value.
It compares price with an older value of the average, not the current one.
How to use it
- Use peaks and troughs to estimate the length of recent cycles.
- Some traders watch zero crossings to time swings inside a range.
- Use the centered view to study past cycles, and the default view for the latest bars.
- Compare cycle highs with price highs.
These are ways some traders read it, for learning. They are not trade signals.
Settings
| Setting | Default |
|---|---|
| Settings | |
| LengthLookback of the simple moving average that price is detrended against. The comparison is displaced by Length / 2 + 1 bars. | 21 |
| SourcePrice series used in the detrending calculation.Options: Close, Open, High, Low, HL2, HLC3, OHLC4, HLCC4 | Close |
| CenteredShifts the oscillator back by Length / 2 + 1 bars so it is centered on the prices it detrends. The most recent bars then show no value. | Off |
| Style | |
| DPOColor of the line when it sits exactly at zero. | #787b86 |
| Above ZeroColor of the line and fill while the oscillator is above zero. | #089981 |
| Below ZeroColor of the line and fill while the oscillator is below zero. | #f23645 |
| Zero LineColor of the zero reference line. | #787b86 |
Alerts
You can alert on its line crossing a value or the candle close (from the chart's + menu); checked while ZoroCharts is open.
Notes and limits
- Works on any symbol and timeframe; it only needs candle data.
- It is not built to show trend direction.
Education only. Not financial advice. Indicators mark what happened on the chart; they do not predict what price will do. Trading futures, forex, crypto and other markets carries a high level of risk and may not be suitable for everyone.