
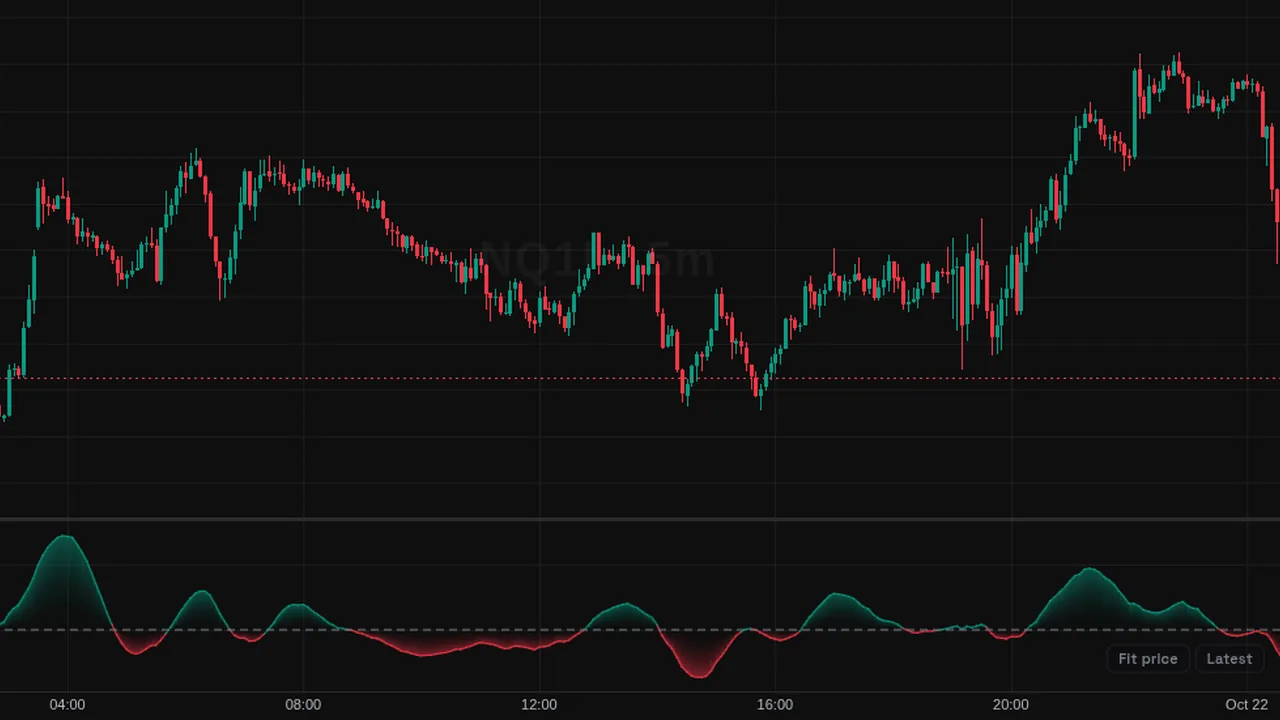
Coppock Curve: a 10-bar weighted average of the sum of a 14-bar and an 11-bar rate of change, around zero.
Overview
The Coppock Curve is a slow momentum line in its own pane. It was first made for monthly charts to spot the end of long declines.
The line and fill are green above zero and red below.
How it works
Coppock = WMA(ROC(source, 14) + ROC(source, 11), 10). ROC is the percent change from that many bars ago.
The original used monthly closes; here the lengths are in chart bars. Because the weighted average favors recent values, the curve turns a little sooner than a simple average would.
How to use it
- Some traders watch an upturn from below zero as a sign of recovering momentum.
- Use zero-line crosses as broad momentum changes.
- Use it on weekly or monthly charts as in its original design.
- Compare its slope with price to see momentum fading.
These are ways some traders read it, for learning. They are not trade signals.
Settings
| Setting | Default |
|---|---|
| Settings | |
| WMA LengthLength of the weighted moving average applied to the sum of the two rates of change. | 10 |
| Long ROC LengthLookback of the long rate of change, in bars. The original definition uses 14 monthly closes. | 14 |
| Short ROC LengthLookback of the short rate of change, in bars. The original definition uses 11 monthly closes. | 11 |
| SourcePrice series used for the rate of change calculations.Options: Close, Open, High, Low, HL2, HLC3, OHLC4, HLCC4 | Close |
| Style | |
| Coppock CurveColor of the Coppock Curve line. | #787b86 |
| BullishLine and fill color while the curve reads above zero. | #089981 |
| BearishLine and fill color while the curve reads below zero. | #f23645 |
| Zero LineColor of the zero reference line. | #787b86 |
Alerts
You can alert on its line crossing a value or the candle close (from the chart's + menu); checked while ZoroCharts is open.
Notes and limits
- Works on any symbol and timeframe; it only needs candle data.
- It is slow by design and better suited to higher timeframes.
- It is not built to mark tops; its original use was spotting the end of declines.
Education only. Not financial advice. Indicators mark what happened on the chart; they do not predict what price will do. Trading futures, forex, crypto and other markets carries a high level of risk and may not be suitable for everyone.