
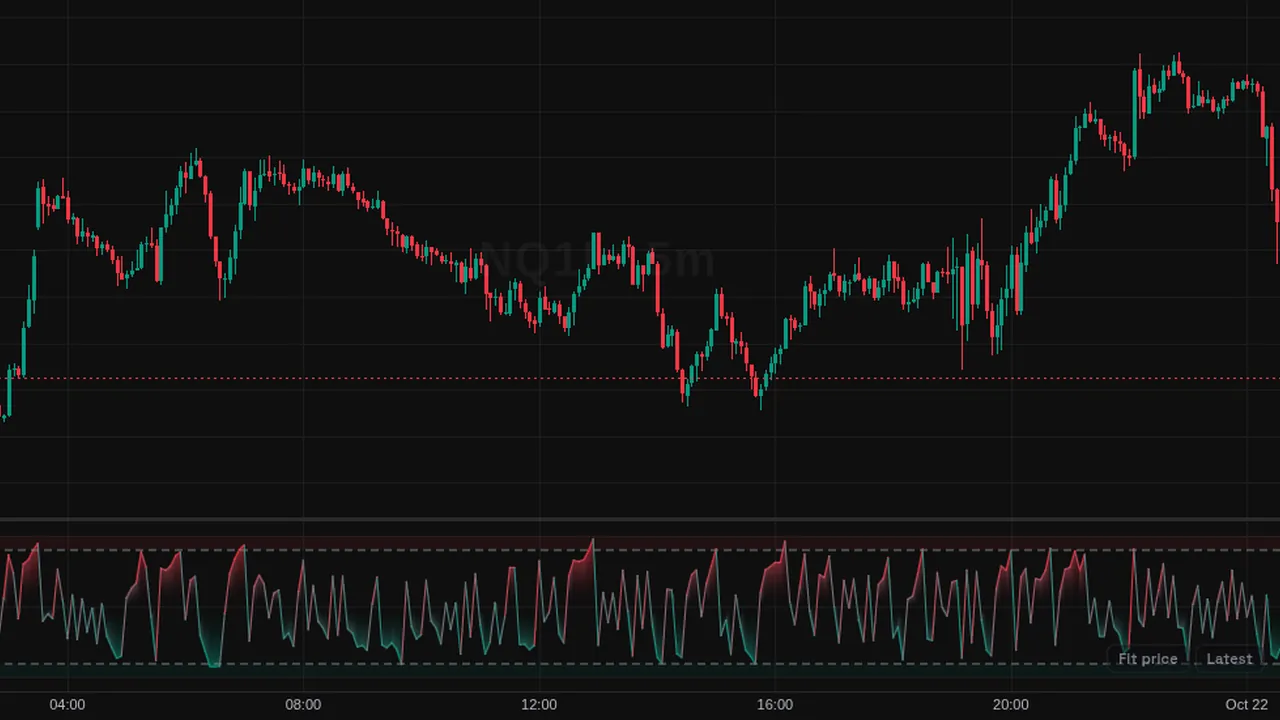
Connors RSI: average of a 3-bar RSI, a streak RSI and a 100-bar percent rank of returns, with levels at 90 and 10.
Overview
Connors RSI (CRSI) is a short-term oscillator from 0 to 100 in its own pane. It blends three parts into one line. Levels sit at 90 (overbought) and 10 (oversold).
The line shifts toward red near overbought and green near oversold.
How it works
CRSI = (RSI(close, 3) + RSI(streak, 2) + PercentRank(1-bar ROC, 100)) / 3.
The streak counts how many bars in a row closed up (positive) or down (negative). PercentRank shows where today's one-bar change sits among the last 100.
How to use it
- Some traders watch readings under 10 or over 90 as short-term stretched conditions.
- Use it on daily charts to spot short pullbacks within a trend.
- Pair it with a longer trend filter so you read it in context.
- Watch how quickly it leaves extreme zones.
These are ways some traders read it, for learning. They are not trade signals.
Settings
| Setting | Default |
|---|---|
| Settings | |
| RSI LengthLength of the Wilder RSI applied to the closing price. | 3 |
| Streak RSI LengthLength of the Wilder RSI applied to the up/down close streak. | 2 |
| Percent Rank LengthLookback of the percent rank applied to the 1-bar rate of change of the closing price. | 100 |
| Overbought LevelLevel above which the oscillator is considered overbought. | 90 |
| Oversold LevelLevel below which the oscillator is considered oversold. | 10 |
| Style | |
| CRSI LineColor of the Connors RSI line. | #787b86 |
| OversoldLine, fill and zone color toward and below the oversold level. | #089981 |
| OverboughtLine, fill and zone color toward and above the overbought level. | #f23645 |
| LevelsColor of the overbought and oversold levels. | #787b86 |
Alerts
You can alert on its line crossing a value or the candle close (from the chart's + menu); checked while ZoroCharts is open.
Notes and limits
- Works on any symbol and timeframe; it only needs candle data.
- It is built for short swings and moves fast.
Education only. Not financial advice. Indicators mark what happened on the chart; they do not predict what price will do. Trading futures, forex, crypto and other markets carries a high level of risk and may not be suitable for everyone.