
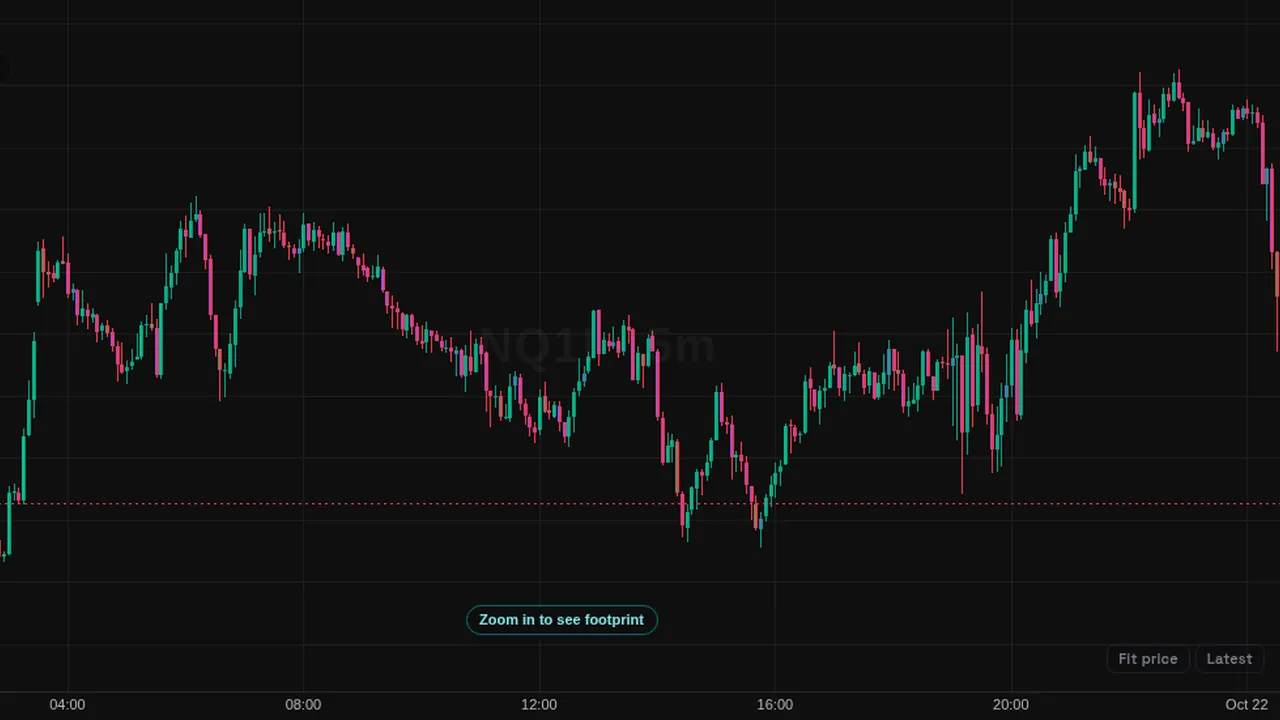
Delta drawn on the price chart in many styles, such as a session delta profile, built from the futures trade stream.
Overview
Delta styles (L1) draws buying minus selling volume directly on the price chart. Its Style setting picks the look; the default is a session delta profile that shows net buying or selling at each price.
Other styles include time blocks, a recent window, key prices per candle and a summary box. You can add it more than once with different styles.
How it works
It uses the same delta maths as the standard Delta styles tool, fed by the futures trade stream. Trades are grouped into price rows (auto size by default), and strong delta is flagged when it reaches 2.5 times the average absolute delta.
How to use it
- Use the session profile to see at which prices buyers or sellers were most active.
- Some traders watch big delta at a level that price then fails to move past.
- Use the summary box for the last few minutes of net flow.
These are ways some traders read it, for learning. They are not trade signals.
Settings
| Setting | Default |
|---|---|
| StyleOptions: H1 Session delta profile, H2 Split bid/ask profile, H3 Volume profile + delta, H4 Visible range vs last 30 min, H5 Delta profile per time block, H6 Delta ladder, V3 Delta numbers, V4 Delta-coloured candles + absorption… | H1 Session delta profile |
| Row size (ticks, 0 = auto) | 0 |
| Profile width % | 25 |
| Block lengthOptions: 30m, 1h | 30m |
| Recent window (minutes) | 30 |
| Big / strong delta at (x average |delta|) | 2.5 |
| Key prices per candle | 5 |
| Last N minutes | 5 |
| Box positionOptions: top right, bottom right, top left | top right |
| Show numbers | On |
| Buyers | #03c988 |
| Sellers | #9d4dff |
Notes and limits
- Uses the futures trade stream (Data feed L1). Futures L1 data is free for members who sign the market data agreement.
- No longer in the Indicators window: futures order flow is now the (L2) tools, part of Pro. A saved chart that still holds this one is switched to Delta (L2) automatically.
- No data means a plain note; nothing is estimated from candles.
Education only. Not financial advice. Indicators mark what happened on the chart; they do not predict what price will do. Trading futures, forex, crypto and other markets carries a high level of risk and may not be suitable for everyone.