
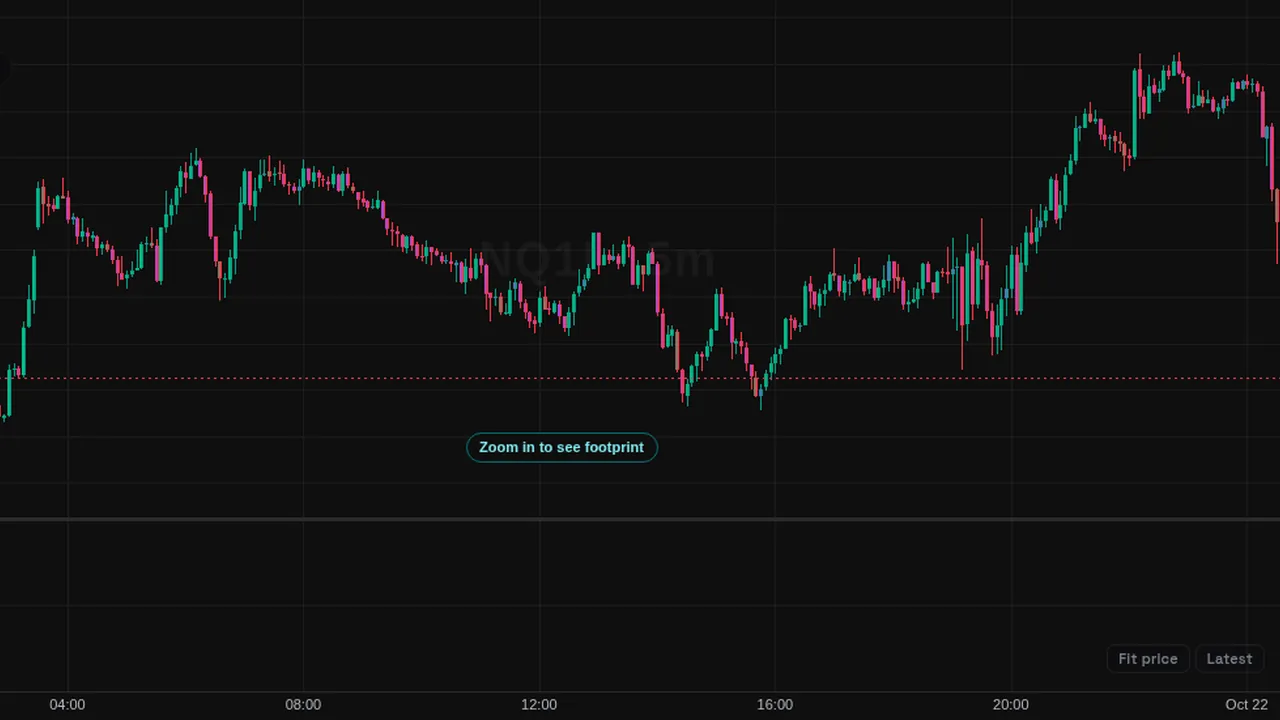
The running total of buying minus selling volume from the futures trade stream, as candles or a line, reset each session.
Overview
Cumulative Delta (L1) adds up each bar's delta into a running total in its own pane. A rising line means more volume has traded at the ask than at the bid since the reset.
You can show it as candles (open, high, low and close of the running total within each bar) or as a line.
How it works
Trades from the futures trade stream are split into buys and sells by the side they hit, summed per bar and added to the total. By default the total resets each session at 18:00 New York time.
How to use it
- Use it to see whether buying or selling has been in control over the session.
- Some traders compare new price highs or lows with the cumulative delta at the same time.
- Watch the slope around key levels.
These are ways some traders read it, for learning. They are not trade signals.
Settings
| Setting | Default |
|---|---|
| Show asOptions: candles, line | candles |
| Resetsession = the futures trading day (18:00 New York).Options: session, day, none | session |
| Up | #22d3ee |
| Down | #ff9f1c |
Notes and limits
- Uses the futures trade stream (Data feed L1). Futures L1 data is free for members who sign the market data agreement.
- No longer in the Indicators window: futures order flow is now the (L2) tools, part of Pro. A saved chart that still holds this one is switched to Cumulative Delta (L2) automatically.
- The total depends on the reset point; a different reset gives different numbers.
Education only. Not financial advice. Indicators mark what happened on the chart; they do not predict what price will do. Trading futures, forex, crypto and other markets carries a high level of risk and may not be suitable for everyone.