
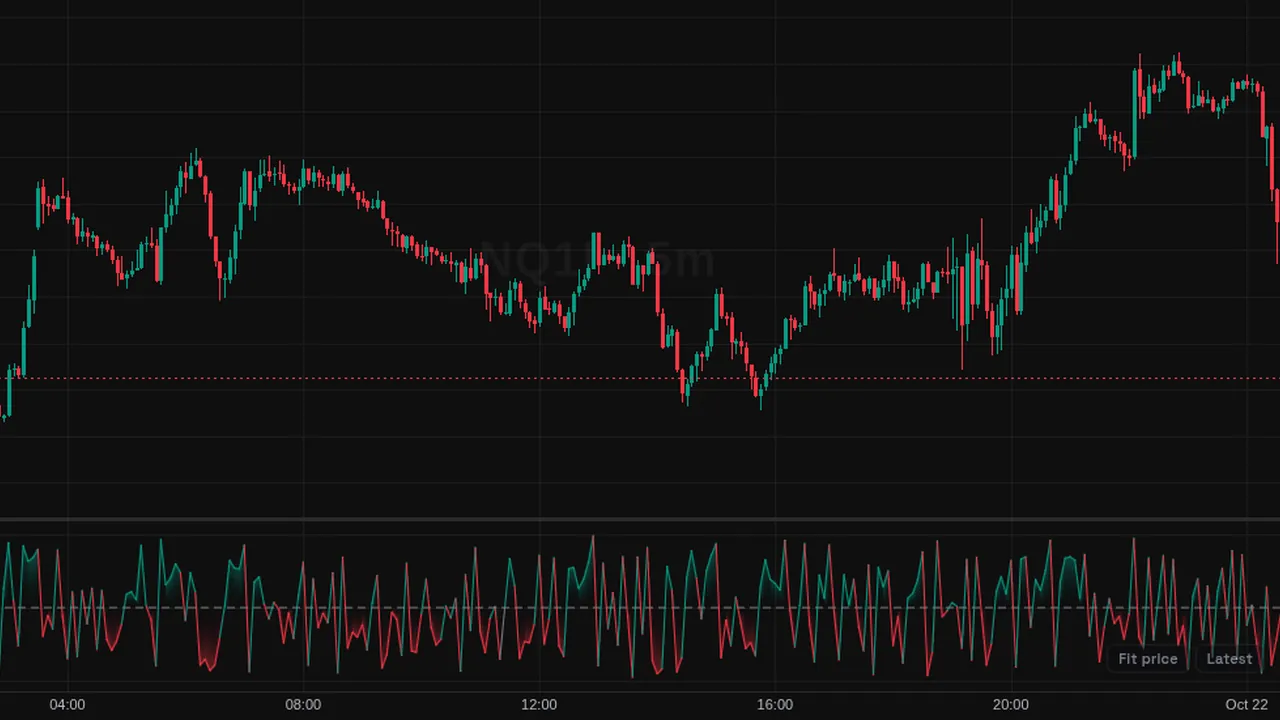
Balance of Power: where each candle closed relative to its open, scaled by its range, from -1 to +1.
Overview
Balance of Power (BOP) shows who controlled each bar. Values near +1 mean buyers pushed price from open to high; values near -1 mean sellers pushed it from open to low.
It plots in its own pane around zero, green above and red below. You can turn on smoothing for a calmer line.
How it works
BOP = (close - open) / (high - low). A bar with no range gives zero.
With Smoothing on, the raw value is passed through a simple moving average of the chosen length (14 by default).
How to use it
- Some traders watch the smoothed line crossing zero as a change in who controls the bars.
- Use long runs above or below zero to see steady buying or selling.
- Compare BOP with price to see if a new high is made with weaker bars.
- Turn smoothing off to inspect single candles.
These are ways some traders read it, for learning. They are not trade signals.
Settings
| Setting | Default |
|---|---|
| Settings | |
| SmoothingSmooth the raw Balance of Power with a simple moving average instead of plotting the single-bar value. | Off |
| LengthSimple moving average length applied when smoothing is enabled. | 14 |
| Style | |
| BOP ColorColor of the line at exactly zero. | #787b86 |
| BullishLine and fill color while the Balance of Power is above zero — buyers in control of the bar. | #089981 |
| BearishLine and fill color while the Balance of Power is below zero — sellers in control of the bar. | #f23645 |
Alerts
You can alert on its line crossing a value or the candle close (from the chart's + menu); checked while ZoroCharts is open.
Notes and limits
- Works on any symbol and timeframe; it only needs candle data.
- The raw form is noisy; most readers use the smoothed line.
Education only. Not financial advice. Indicators mark what happened on the chart; they do not predict what price will do. Trading futures, forex, crypto and other markets carries a high level of risk and may not be suitable for everyone.