
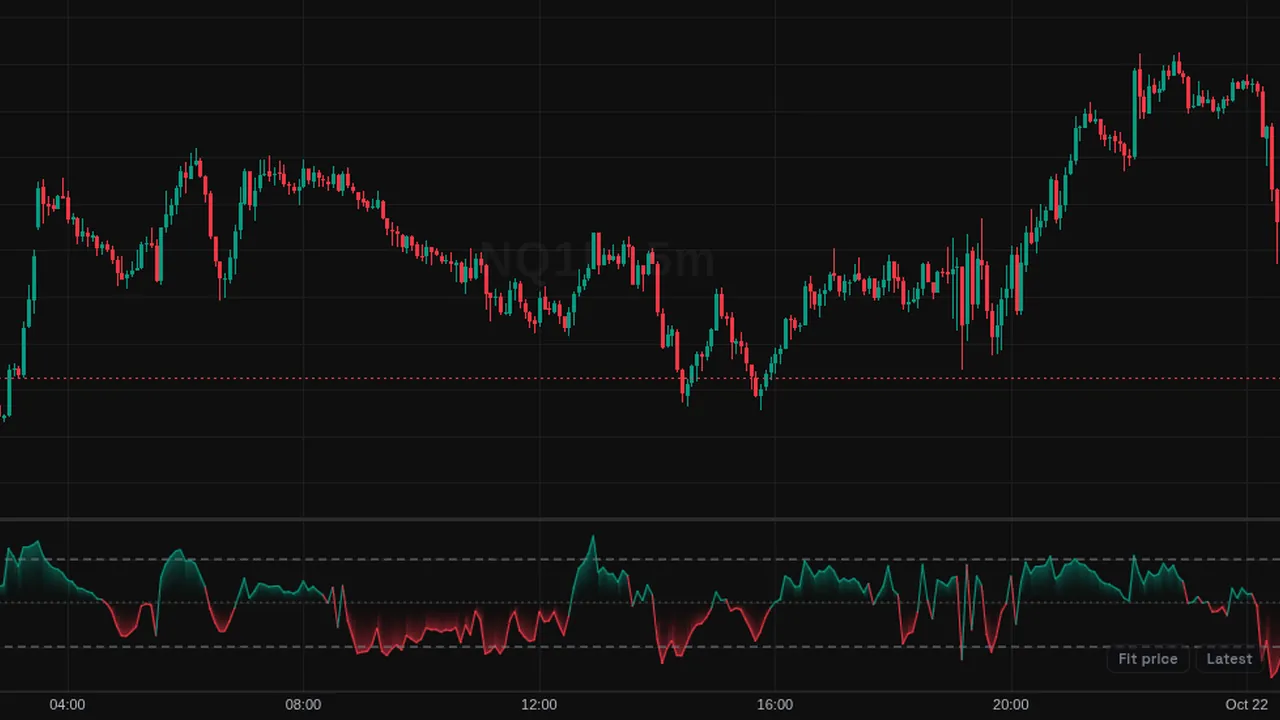
Bollinger %B: where price sits relative to 20-bar, 2-deviation Bollinger Bands; 1 is the upper band, 0 the lower.
Overview
Bollinger %B turns Bollinger Bands into one line in its own pane. A reading of 1 means price is at the upper band, 0 at the lower band, and 0.5 at the middle.
Values above 1 or below 0 mean price is outside the bands. The gradient fill runs from the 0.5 midline.
How it works
%B = (close - lower band) / (upper band - lower band). The bands use a 20-bar SMA and 2 standard deviations by default.
Overbought and oversold levels default to 1 and 0.
How to use it
- Some traders watch readings above 1 or below 0 as price outside its normal range.
- Use crosses of 0.5 to see price moving above or below the middle band.
- Look for divergence: price makes a new high but %B does not.
- Compare it with volume tools to see if moves outside the bands have support.
These are ways some traders read it, for learning. They are not trade signals.
Settings
| Setting | Default |
|---|---|
| Settings | |
| LengthNumber of bars used for the Bollinger Bands basis (a simple moving average) and for the standard deviation. | 20 |
| SourcePrice series the bands are computed from.Options: Close, Open, High, Low, HL2, HLC3, OHLC4, HLCC4 | Close |
| MultiplierStandard deviation multiplier for the upper and lower bands. | 2 |
| Thresholds | |
| OverboughtLevel treated as overbought. 1 is the upper band itself, so readings above the default mean price sits outside the bands. | 1 |
| OversoldLevel treated as oversold. 0 is the lower band itself, so readings below the default mean price sits outside the bands. | 0 |
| Style | |
| BullishColor of %B above the 0.5 midline, where price trades in the upper half of the bands. | #089981 |
| BearishColor of %B below the 0.5 midline, where price trades in the lower half of the bands. | #f23645 |
| Gradient FillVertical gradient between %B and the 0.5 midline, fully transparent at the midline and more opaque at the oscillator value. | On |
| Levels ColorColor of the dashed overbought/oversold levels and of the dotted midline. | #787b86 |
Alerts
You can alert on its line crossing a value or the candle close (from the chart's + menu); checked while ZoroCharts is open.
Notes and limits
- Works on any symbol and timeframe; it only needs candle data.
Education only. Not financial advice. Indicators mark what happened on the chart; they do not predict what price will do. Trading futures, forex, crypto and other markets carries a high level of risk and may not be suitable for everyone.