
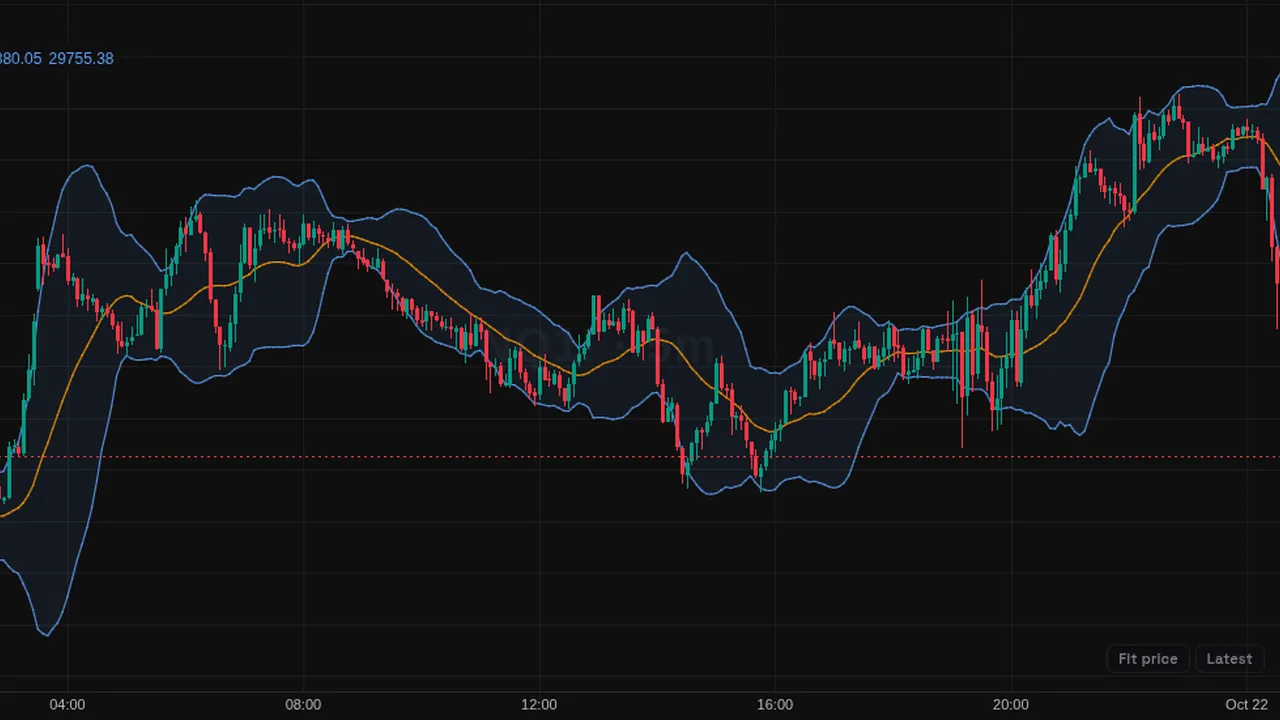
Bollinger Bands: a 20-bar SMA with bands two standard deviations above and below, filled between them.
In plain English
What it shows
- Bollinger Bands draw a moving average with bands set a number of standard deviations (a measure of spread) above and below it.
How traders use it
- Some traders watch the bands tighten and widen to see volatility change.
- Some compare price with the bands to see how stretched it is.
What it does not tell you
- Touching a band does not mean price will reverse.
- Default settings are a starting point, not a rule.
Overview
Bollinger Bands draw a middle line (orange) with an upper and lower band (blue) on the price chart. The bands widen when price swings more and tighten when it is quiet.
The area between the bands is lightly shaded.
How it works
Basis = SMA(close, 20). Upper = basis + 2 x standard deviation of close over 20 bars. Lower = basis - 2 x the same standard deviation.
Length, source and multiplier can be changed.
How to use it
- Some traders watch a tight squeeze of the bands as a sign of low volatility before a larger move.
- Use touches of the bands to see price stretched from its average.
- In strong trends price can walk along one band; some traders read that as strength.
- Use the basis as a mid-line for pullbacks.
These are ways some traders read it, for learning. They are not trade signals.
Settings
| Setting | Default |
|---|---|
| Settings | |
| LengthNumber of bars used to calculate the basis SMA and the standard deviation. | 20 |
| SourcePrice series the bands are calculated on.Options: Close, Open, High, Low, HL2, HLC3, OHLC4, HLCC4 | Close |
| MultiplierNumber of standard deviations added above and below the basis to form the bands. | 2 |
| Style | |
| BasisColor of the basis (middle band) moving average. | #ff9800 |
| BandsColor of the upper and lower bands. | #5b9cf6 |
| FillFill color of the area between the upper and lower bands. | #5b9cf614 |
Alerts
You can alert on its line crossing a value or the candle close (from the chart's + menu); checked while ZoroCharts is open.
Notes and limits
- Works on any symbol and timeframe; it only needs candle data.
- A touch of a band is not a signal on its own.
Education only. Not financial advice. Indicators mark what happened on the chart; they do not predict what price will do. Trading futures, forex, crypto and other markets carries a high level of risk and may not be suitable for everyone.