
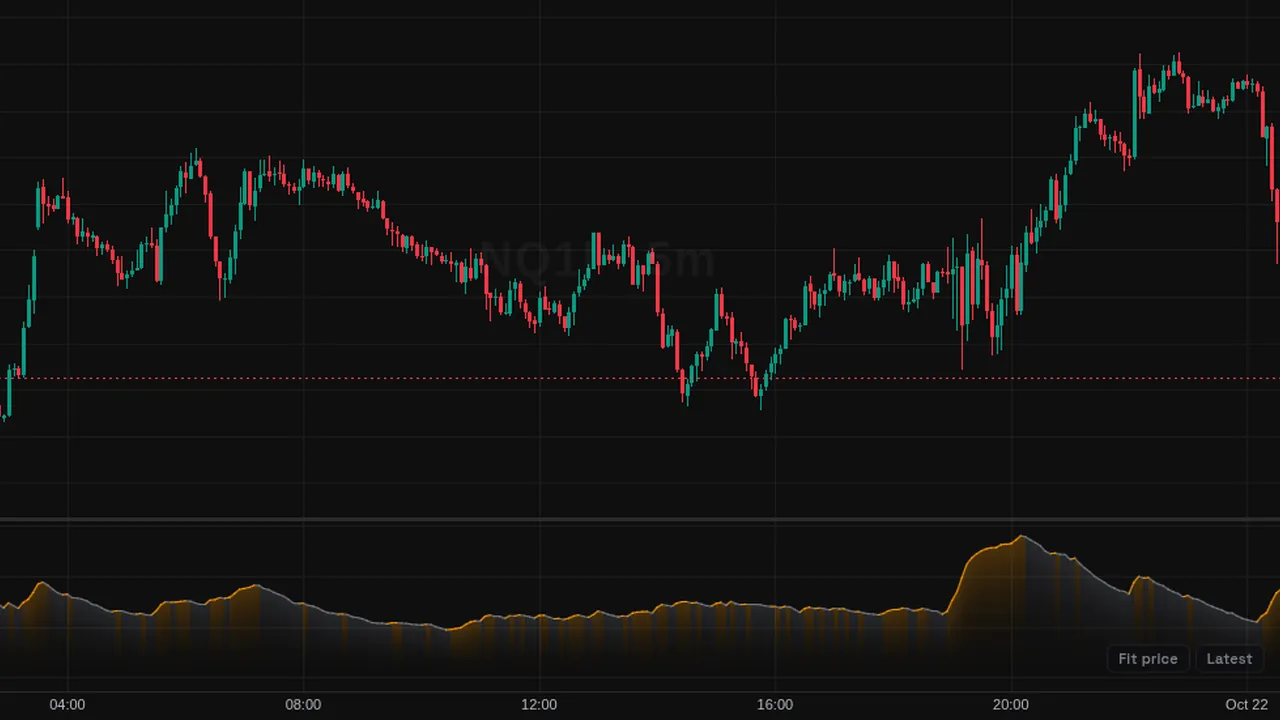
Average True Range: the 14-bar Wilder average of each bar's true range, a plain measure of how much price moves.
Overview
The Average True Range (ATR) measures volatility in its own pane. A higher line means bars are moving more; a lower line means quieter trading. It does not show direction.
The line turns orange while ATR is expanding.
How it works
True range = the largest of: high - low, |high - previous close|, |low - previous close|. ATR = average of true range over 14 bars, smoothed with Wilder's RMA by default.
Other smoothing types can be chosen in the settings.
How to use it
- Some traders size stops as a multiple of ATR so they fit current volatility.
- Use rising ATR to see when moves are getting larger.
- Compare ATR with past readings to see if the market is calm or busy.
- Use it to set position size so risk stays similar across symbols.
These are ways some traders read it, for learning. They are not trade signals.
Settings
| Setting | Default |
|---|---|
| Settings | |
| LengthNumber of bars used to average the true range. | 14 |
| SmoothingMoving average applied to the true range. RMA is Wilder's original smoothing used by the classic ATR.Options: RMA, SMA, EMA, WMA | RMA |
| Style | |
| ATR LineColor of the ATR line while volatility contracts or holds flat. | #787b86 |
| ExpandingColor of the ATR line while it rises — volatility expanding bar to bar. | #ff9800 |
Alerts
You can alert on its line crossing a value or the candle close (from the chart's + menu); checked while ZoroCharts is open.
Notes and limits
- Works on any symbol and timeframe; it only needs candle data.
- ATR is in price units, so values differ across symbols.
Education only. Not financial advice. Indicators mark what happened on the chart; they do not predict what price will do. Trading futures, forex, crypto and other markets carries a high level of risk and may not be suitable for everyone.