
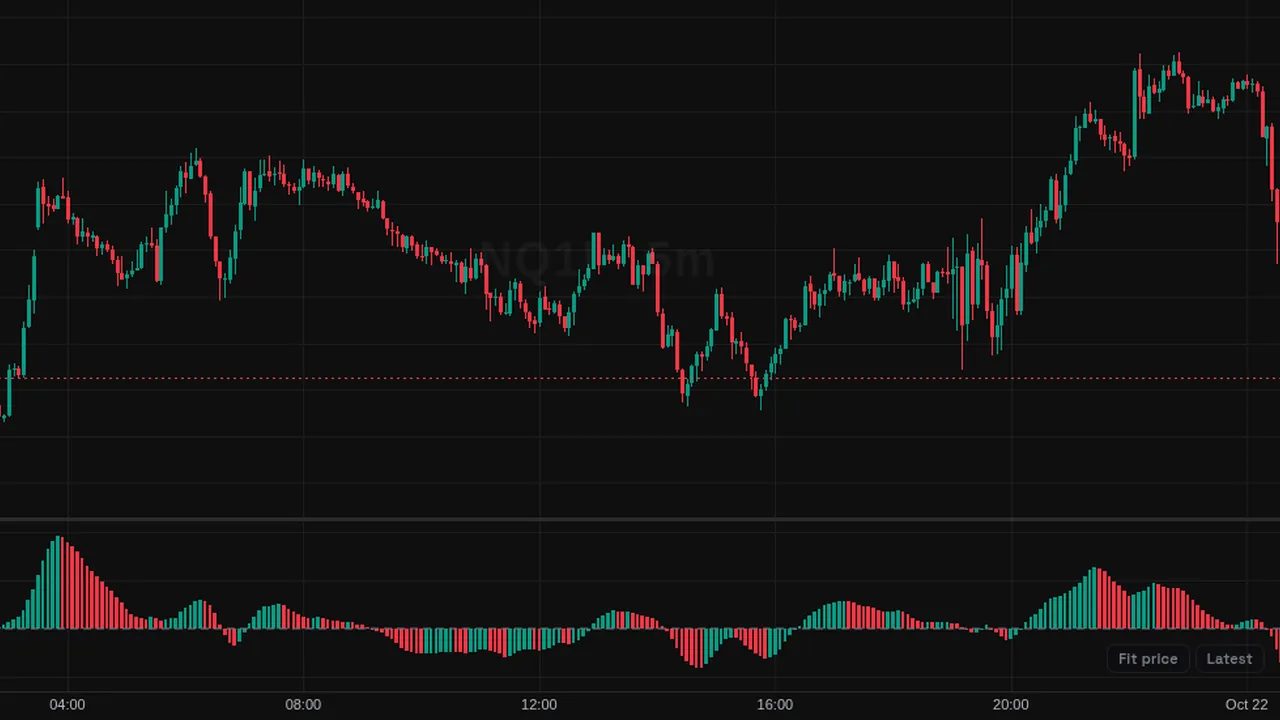
Awesome Oscillator histogram: 5-bar minus 34-bar simple average of median price, green when rising and red when falling.
Overview
The Awesome Oscillator shows momentum as a histogram in its own pane, around a zero line. Bars are green when the value is higher than on the previous bar and red when lower or equal.
It was created by Bill Williams to compare recent momentum with a longer view.
How it works
AO = SMA(median price, 5) - SMA(median price, 34), where median price = (high + low) / 2.
Above zero, the short-term average is above the long-term one; below zero, it is under it.
How to use it
- Some traders watch zero-line crosses as a sign of a change in momentum.
- Look at the color sequence: a run of green bars shows momentum building.
- Some traders look for a saucer pattern: three bars that dip and turn on the same side of zero.
- Compare two peaks on the same side of zero with price peaks to look for divergence.
These are ways some traders read it, for learning. They are not trade signals.
Settings
| Setting | Default |
|---|---|
| Style | |
| RisingHistogram color when the oscillator is higher than on the previous bar. | #089981 |
| FallingHistogram color when the oscillator is lower than or equal to the previous bar. | #f23645 |
| Zero LineColor of the zero reference line. | #787b86 |
Alerts
You can alert on its line crossing a value or the candle close (from the chart's + menu); checked while ZoroCharts is open.
Notes and limits
- Works on any symbol and timeframe; it only needs candle data.
- The 5 and 34 lengths are fixed in the classic formula.
Education only. Not financial advice. Indicators mark what happened on the chart; they do not predict what price will do. Trading futures, forex, crypto and other markets carries a high level of risk and may not be suitable for everyone.