
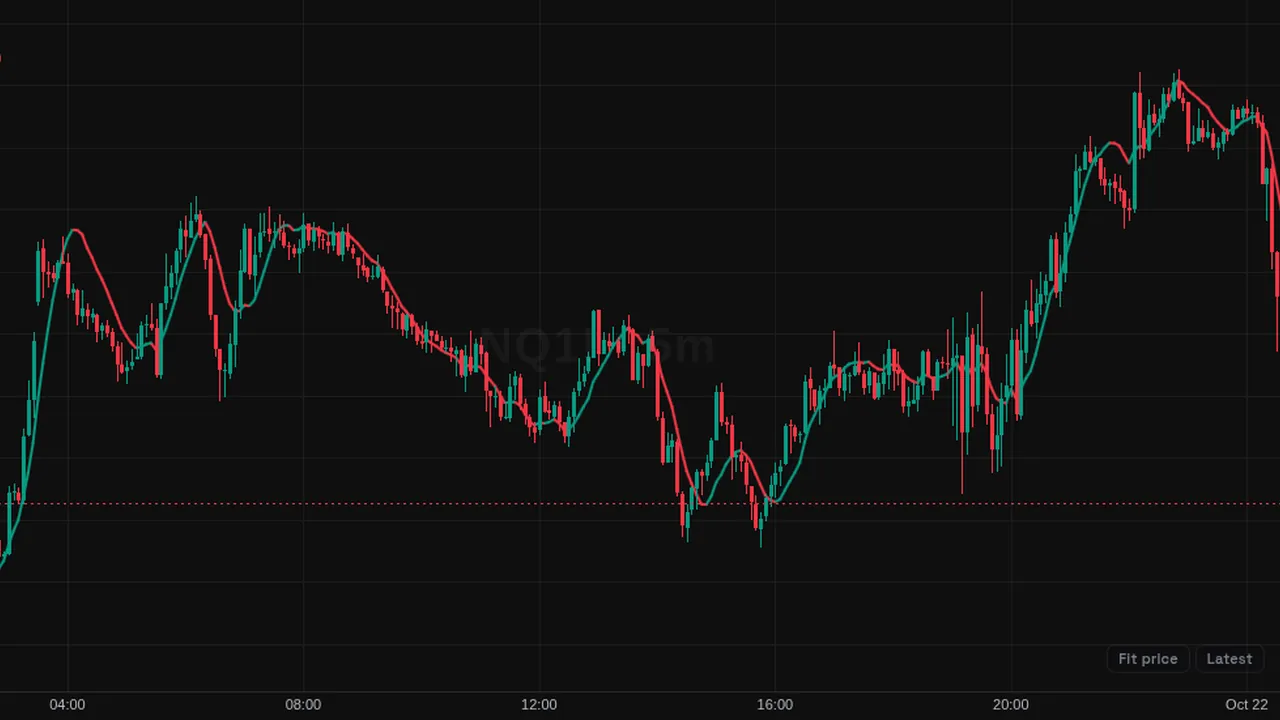
Zero-lag EMA: an exponential average with a de-lag step, 21 bars by default, colored by slope.
Overview
The Zero-Lag Exponential Moving Average (ZLEMA) is an EMA that tries to cancel most of the usual delay. It hugs price more closely than a plain EMA of the same length.
With Slope Trend Coloring on, it is green while rising, red while falling and gray when flat. Length is 21 by default.
How it works
An EMA of length N lags by about (N - 1) / 2 bars. ZLEMA first builds a de-lagged source: price + (price - price from that many bars ago). It then takes an EMA of that series with a smoothing share of 2 / (N + 1).
The extra step adds recent momentum back in, which reduces lag but can cause small overshoots.
How to use it
- Use it as a faster trend line than a standard EMA.
- Some traders watch the color flip as an early sign of a turn.
- Compare it with a normal EMA to see how much lag is removed.
- Use it on lower timeframes where quick response matters.
These are ways some traders read it, for learning. They are not trade signals.
Settings
| Setting | Default |
|---|---|
| Settings | |
| SourcePrice series the average de-lags and then smooths.Options: Close, Open, High, Low, HL2, HLC3, OHLC4, HLCC4 | Close |
| ZLEMA LengthEMA length N. It sets both the smoothing (alpha = 2 / (N + 1)) and the correction: an EMA of length N lags by about (N − 1)/2 bars, and the de-lagging step is sized to cancel exactly that. | 21 |
| Style | |
| Slope Trend ColoringColors the line by its slope — bullish while it rises, bearish while it falls. Disable to draw it in the neutral color. | On |
| Bullish | #089981 |
| Bearish | #f23645 |
| Neutral | #787b86 |
| Line WidthWidth of the plotted line, in pixels. | 2 |
Alerts
You can alert on its line crossing a value or the candle close (from the chart's + menu); checked while ZoroCharts is open.
Notes and limits
- Works on any symbol and timeframe; it only needs candle data.
- It can overshoot after sharp moves.
Education only. Not financial advice. Indicators mark what happened on the chart; they do not predict what price will do. Trading futures, forex, crypto and other markets carries a high level of risk and may not be suitable for everyone.