
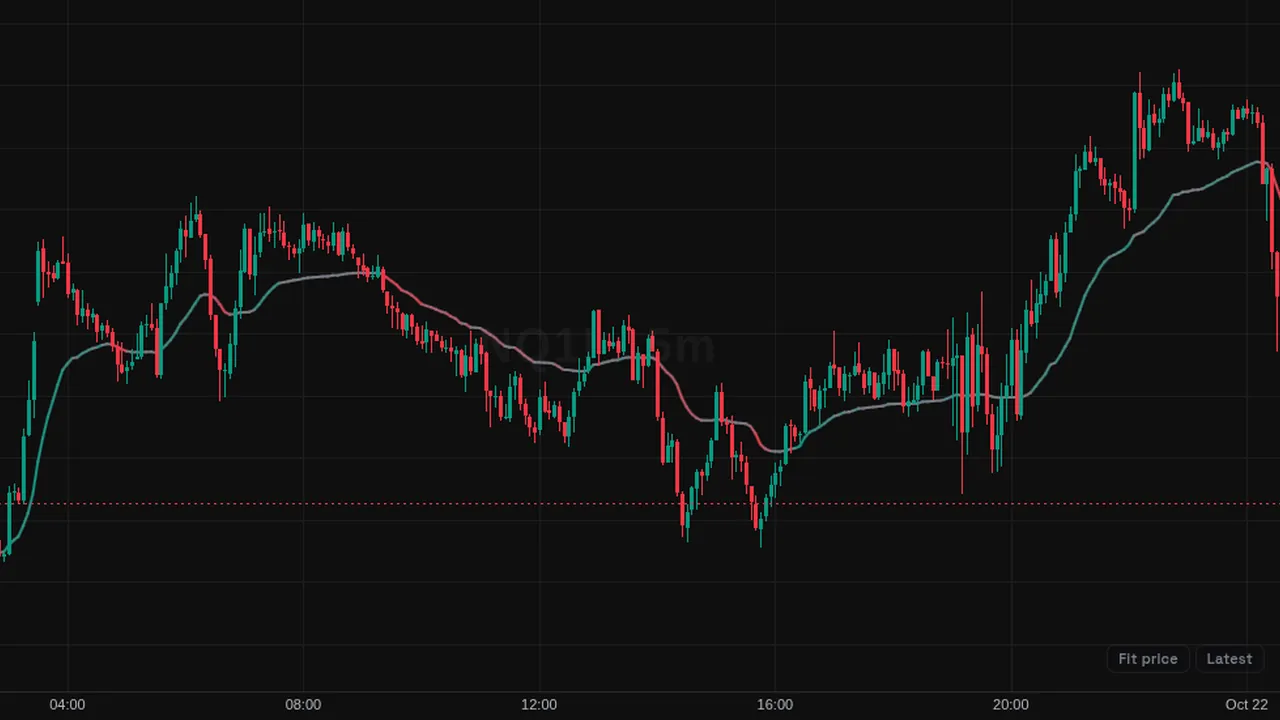
VIDYA: an adaptive moving average that speeds up in strong moves and slows in quiet ones, colored by trend regime.
Overview
The Variable Index Dynamic Average (VIDYA) is a moving average whose speed changes bar by bar. It moves faster when momentum is strong and almost stops when the market is quiet.
With Trend Regime Coloring on, it is green while sloping up, red while sloping down and gray when flat. The adaptive gradient fades the color as momentum dies.
How it works
VIDYA starts from an EMA smoothing share of 2 / (N + 1), with N = 12 by default, and multiplies it by a scaler each bar. In Momentum mode the scaler is the absolute Chande Momentum Oscillator (9 bars) divided by 100. In Volatility mode it is a short standard deviation divided by a reference standard deviation (30 bars).
The line counts as flat when its one-bar change is below 0.05 of ATR(14).
How to use it
- Use the flat color to spot ranges where the average stops moving.
- Some traders watch the regime color change as a sign of a new trend.
- Use it as a trend line that stays still in noise.
- Compare Momentum and Volatility modes to see which suits the symbol.
These are ways some traders read it, for learning. They are not trade signals.
Settings
| Setting | Default |
|---|---|
| Settings | |
| SourcePrice series the average smooths. VIDYA is classically computed on the close.Options: Close, Open, High, Low, HL2, HLC3, OHLC4, HLCC4 | Close |
| VIDYA LengthEMA-equivalent length N of the base smoothing constant, alpha = 2 / (N + 1). The adaptive scaler rescales this base speed bar by bar. | 12 |
| Adaptive ScalerBar-by-bar measure that rescales the smoothing constant. Momentum divides the absolute Chande Momentum Oscillator by 100; Volatility is Chande's original short-term over reference standard deviation.Options: Momentum (|CMO|), Volatility (StDev Ratio) | Momentum (|CMO|) |
| Scaler LookbackLookback of the adaptive scaler — the CMO period in momentum mode, or the short-term standard deviation window in volatility mode. | 9 |
| Reference StDev LengthVolatility mode only — window of the reference standard deviation the short-term reading is divided by. | 30 |
| Trend Regime | |
| Flat ThresholdOne-bar change of VIDYA, as a fraction of ATR, below which the line reads as flat. | 0.05 |
| ATR Normalization LengthATR window used to normalize VIDYA's one-bar slope, so the flat threshold behaves consistently across symbols and timeframes. | 14 |
| Style | |
| Trend Regime ColoringColors VIDYA by its regime read — bullish while sloping up beyond the flat threshold, bearish while sloping down, flat inside congestion. | On |
| Adaptive GradientBlends the trend color toward the flat color according to the adaptive scaler, so the line pales as momentum dies. | On |
Show all 14 settings
| Setting | Default |
|---|---|
| Bullish | #089981 |
| Bearish | #f23645 |
| Flat | #787b86 |
| Neutral | #787b86 |
| Line WidthWidth of the plotted line, in pixels. | 2 |
Alerts
You can alert on its line crossing a value or the candle close (from the chart's + menu); checked while ZoroCharts is open.
Notes and limits
- Works on any symbol and timeframe; it only needs candle data.
- It can stay flat for long periods in quiet markets.
Education only. Not financial advice. Indicators mark what happened on the chart; they do not predict what price will do. Trading futures, forex, crypto and other markets carries a high level of risk and may not be suitable for everyone.