
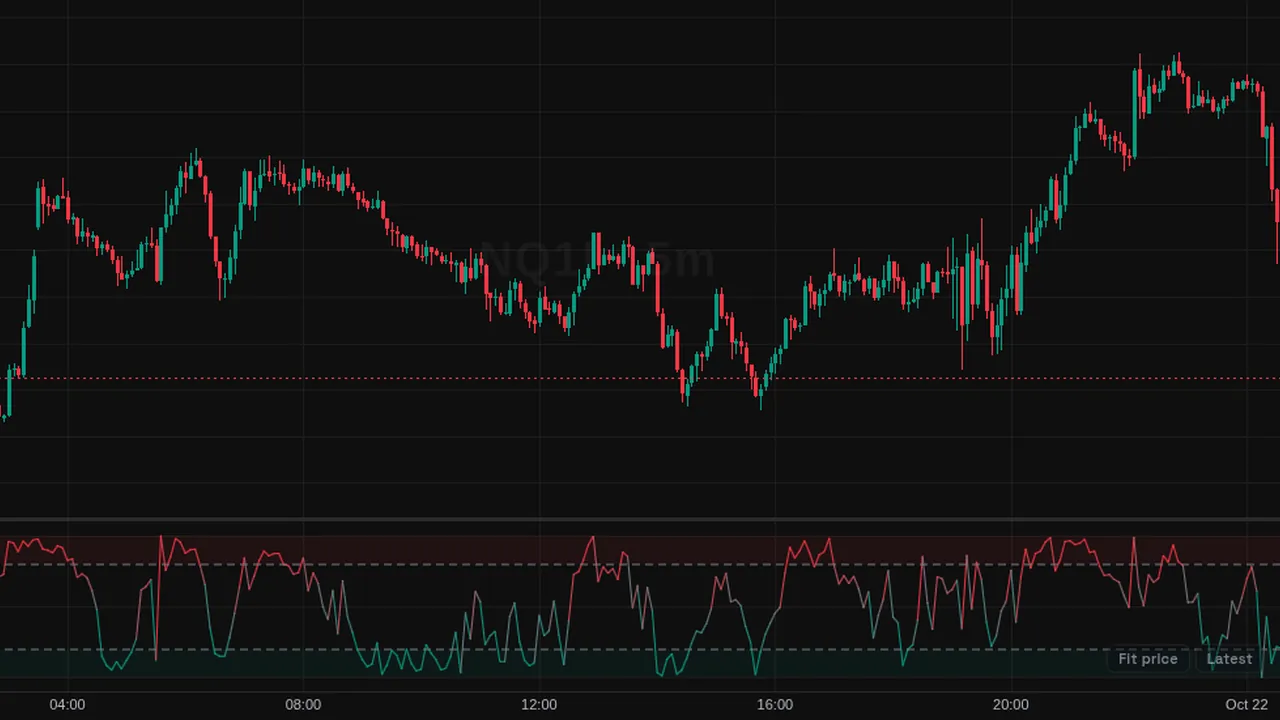
Williams %R: where the close sits in its 14-bar high-low range, from 0 to -100, with levels at -20 and -80.
Overview
Williams %R shows where the close sits within the recent range, in its own pane. It runs from 0 (at the high) to -100 (at the low). Levels sit at -20 (overbought) and -80 (oversold).
It is a mirror of the fast stochastic.
How it works
%R = (highest high of 14 bars - close) / (highest high - lowest low) x -100.
A close at the top of the range gives 0; at the bottom, -100. It uses the high and low of the window, so a single large bar can shift the range.
How to use it
- Some traders watch readings above -20 or below -80 as stretched.
- Use moves out of those zones as signs of a turn starting.
- In strong trends it can stay in a zone; some read that as strength.
- Look for divergence with price.
These are ways some traders read it, for learning. They are not trade signals.
Settings
| Setting | Default |
|---|---|
| Settings | |
| LengthLookback length of the highest high / lowest low range. 14 is the classic setting. | 14 |
| SourceSeries located within the lookback range. Close is the classic choice.Options: Close, Open, High, Low, HL2, HLC3, OHLC4, HLCC4 | Close |
| Overbought LevelLevel above which the oscillator is considered overbought. | -20 |
| Oversold LevelLevel below which the oscillator is considered oversold. | -80 |
| Style | |
| %R LineColor of the %R line between the levels. Toward either level it blends into that level’s color. | #787b86 |
| OverboughtColor of the line and zone shading at and above the overbought level. | #f23645 |
| OversoldColor of the line and zone shading at and below the oversold level. | #089981 |
Alerts
You can alert on its line crossing a value or the candle close (from the chart's + menu); checked while ZoroCharts is open.
Notes and limits
- Works on any symbol and timeframe; it only needs candle data.
- It reacts fast and can be noisy.
Education only. Not financial advice. Indicators mark what happened on the chart; they do not predict what price will do. Trading futures, forex, crypto and other markets carries a high level of risk and may not be suitable for everyone.