
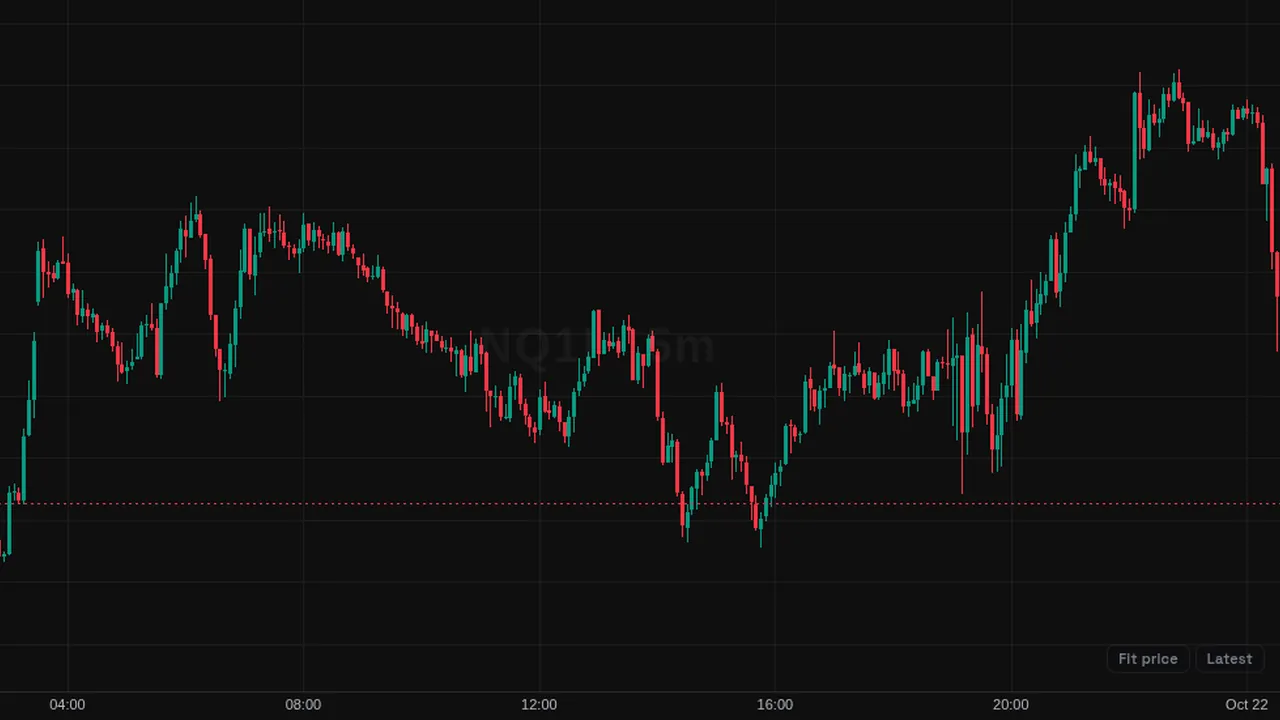
Draws one past session's prior-day levels, open, gap, opening range and initial balance, with a marker where the outcome happened.
In plain English
What it shows
- One past session's key levels on the chart: previous day high, low and close, the open, the gap, the opening range and the initial balance. A marker shows where the studied outcome happened.
- It is opened from a Market Stats page.
How traders use it
- Use it to look at one example day from the statistics, with every level drawn.
- Step through several dates to see how the same levels looked on different days.
What it does not tell you
- The statistics are how often something happened in the past, not a forecast.
- On its own, without a Market Stats link, it has no session to draw.
Overview
TradeZoro Market Stats session is opened from the Market Stats page. It takes you to the chosen date and draws the levels for that one session: prior day high, low and close, the open, the gap band, the opening range (15 or 30 minutes) and the initial balance lines. A marker shows the minute the studied outcome happened.
How it works
Nothing is fetched by the indicator: the numbers come from the Market Stats page when you open the link. The chart switches to the symbol and timeframe, loads older history until that session is on screen, and zooms to that day.
The stats use a back-adjusted continuous contract, so the levels are shifted by the open basis to line up with the chart's bars. SPX levels are drawn on the ES chart shifted the same way, and the chip says so. The only setting turns the labels on or off.
How to use it
- Use it to see how a session from the statistics actually played out on the chart.
- Some traders study where the opening range broke compared with the prior day levels.
- Use the marker to find the moment the outcome happened and look at the bars around it.
These are ways some traders read it, for learning. They are not trade signals.
Settings
| Setting | Default |
|---|---|
| Labels | On |
Notes and limits
- It works from links on the Market Stats page; added on its own it has no session to draw.
- The statistics are historical frequencies, not predictions.
- On hourly charts the alignment can be about 30 minutes early.
Education only. Not financial advice. Indicators mark what happened on the chart; they do not predict what price will do. Trading futures, forex, crypto and other markets carries a high level of risk and may not be suitable for everyone.