
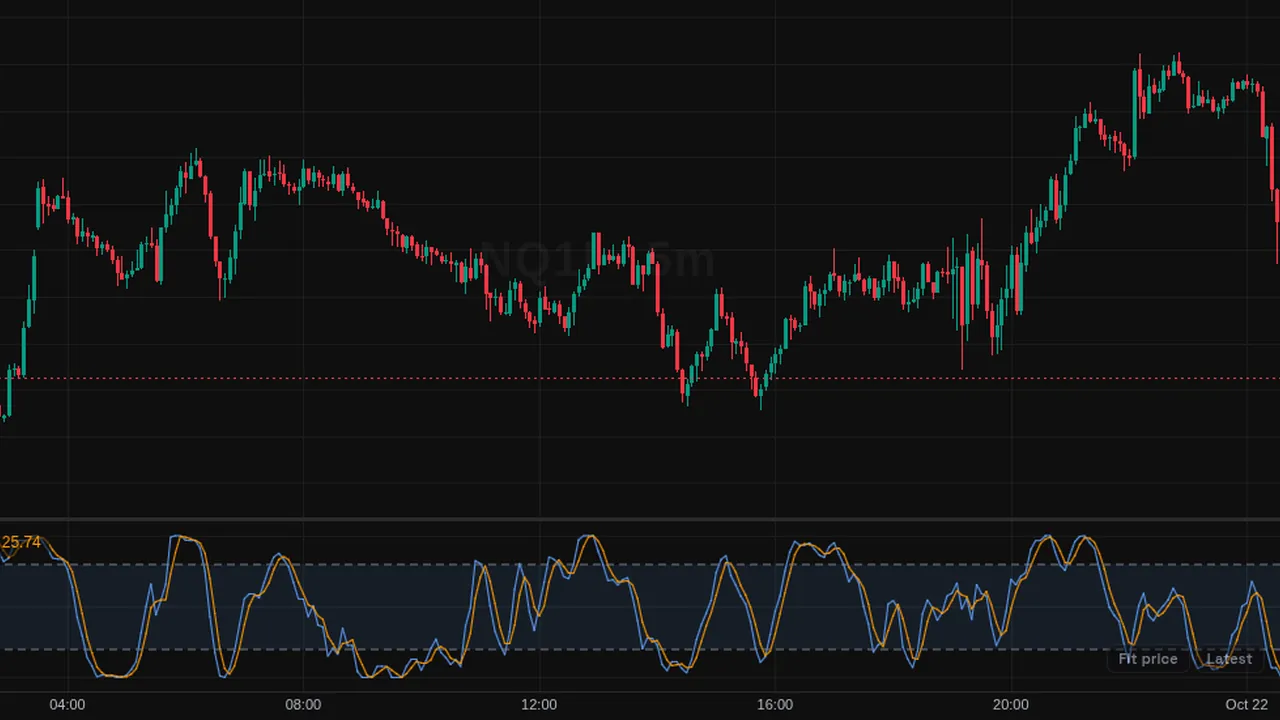
Stochastic RSI: a stochastic of the 14-bar RSI, with smoothed %K and %D lines and levels at 80 and 20.
Overview
The Stochastic RSI applies the stochastic formula to RSI instead of price. It moves between 0 and 100 in its own pane, faster than RSI, with a blue %K, an orange %D and a zone between 80 and 20.
It shows where RSI sits in its own recent range.
How it works
First RSI(close, 14). Then raw = (RSI - lowest RSI of 14 bars) / (highest RSI - lowest RSI) x 100. %K = 3-bar SMA of raw. %D = 3-bar SMA of %K.
Because it measures RSI against itself, it often reaches 0 or 100.
How to use it
- Some traders watch moves above 80 or below 20 as short-term extremes.
- Use %K crossing %D as a quick momentum signal.
- Pair it with a trend filter so you read it in context.
- Watch for it leaving an extreme zone.
These are ways some traders read it, for learning. They are not trade signals.
Settings
| Setting | Default |
|---|---|
| Settings | |
| RSI SourcePrice series the RSI is computed on.Options: Close, Open, High, Low, HL2, HLC3, OHLC4, HLCC4 | Close |
| RSI LengthLookback length of the Wilder RSI. | 14 |
| Stochastic LengthLookback over which the highest and lowest RSI values are taken. | 14 |
| %K SmoothingSimple moving average length applied to the stochastic of RSI to form %K. | 3 |
| %D SmoothingSimple moving average length applied to %K to form the %D signal line. | 3 |
| Overbought LevelLevel above which the oscillator is considered overbought. | 80 |
| Oversold LevelLevel below which the oscillator is considered oversold. | 20 |
| Style | |
| %K ColorColor of the %K line. | #5b9cf6 |
| %D ColorColor of the %D signal line. | #ff9800 |
| Zone FillFill color of the area between the overbought and oversold levels. | #5b9cf61a |
Alerts
You can alert on its line crossing a value or the candle close (from the chart's + menu); checked while ZoroCharts is open.
Notes and limits
- Works on any symbol and timeframe; it only needs candle data.
- It is very sensitive and gives many signals.
Education only. Not financial advice. Indicators mark what happened on the chart; they do not predict what price will do. Trading futures, forex, crypto and other markets carries a high level of risk and may not be suitable for everyone.