
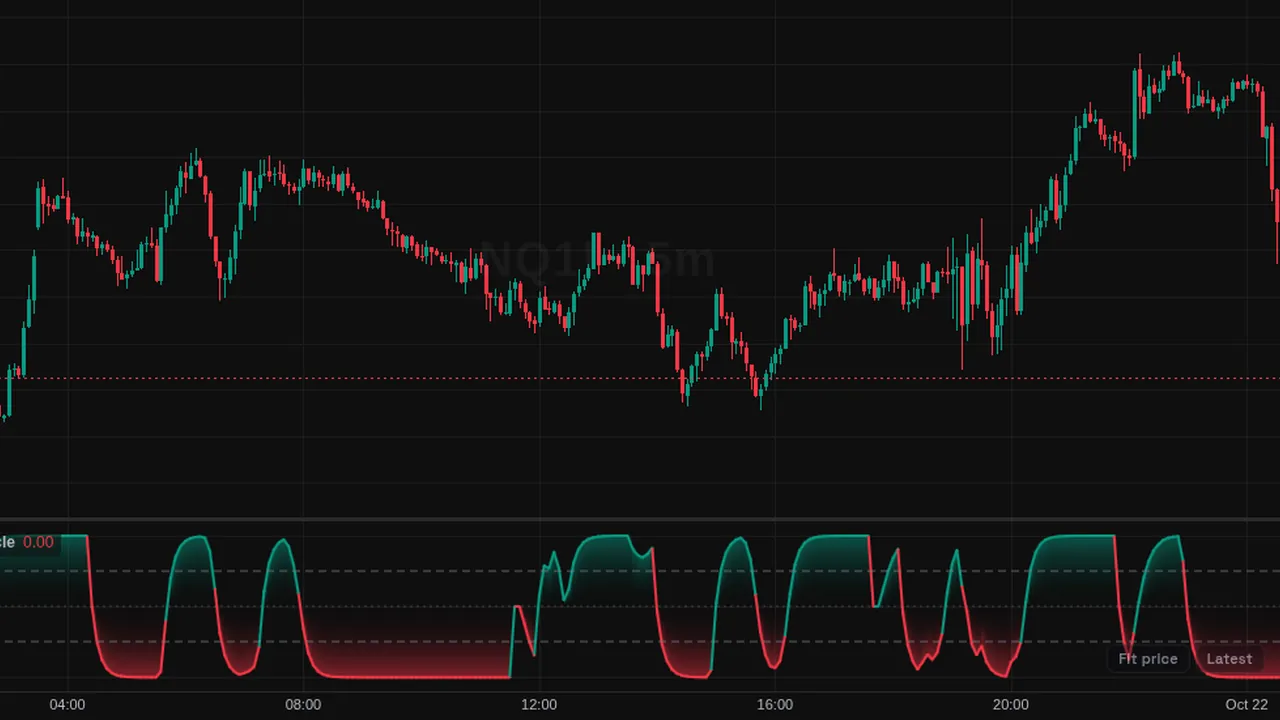
Schaff Trend Cycle: a MACD run through two stochastic passes, from 0 to 100, with triggers at 75 and 25.
Overview
The Schaff Trend Cycle (STC) is a fast trend oscillator from 0 to 100 in its own pane. Trigger lines sit at 75 and 25.
The line is green while bullish and red while bearish, with a gradient fill from the midline.
How it works
First a MACD is built from 23 and 50 bar EMAs. Then a stochastic of that MACD is taken over 10 bars and smoothed with a factor of 0.5. A second stochastic pass with the same smoothing gives the final STC.
The two passes make it move quickly between the top and bottom of its range.
How to use it
- Some traders watch a cross up through 25 as an early sign of an uptrend.
- Watch a cross down through 75 as an early sign of a downtrend.
- Use flat lines at the top or bottom as a sign the trend is steady.
- Pair it with price structure to filter quick flips.
These are ways some traders read it, for learning. They are not trade signals.
Settings
| Setting | Default |
|---|---|
| Settings | |
| SourcePrice series used to build the MACD that the trend cycle is measured on.Options: Close, Open, High, Low, HL2, HLC3, OHLC4, HLCC4 | Close |
| Fast LengthFast EMA length of the underlying MACD. | 23 |
| Slow LengthSlow EMA length of the underlying MACD. | 50 |
| Cycle LengthWindow of the two stochastic passes. Each pass measures where its input sits inside the range of its own values over this many bars. | 10 |
| Smoothing Factor%D style recursive smoothing applied after each stochastic pass. 0.5 is the published default. | 0.5 |
| Trigger Levels | |
| Upper TriggerUpper trigger line. A cross down through it flags an emerging downtrend. | 75 |
| Lower TriggerLower trigger line. A cross up through it flags an emerging uptrend. | 25 |
| Style | |
| Bullish ColorColor of the trend cycle line and gradient while the cycle holds the upper half of its 0-100 scale. | #089981 |
| Bearish ColorColor of the trend cycle line and gradient while the cycle holds the lower half of its 0-100 scale. | #f23645 |
| Levels ColorColor of the dashed trigger lines and the dotted midline. | #787b86 |
| Gradient FillVertical gradient between the midline and the trend cycle, fading out toward the midline. | On |
Alerts
You can alert on its line crossing a value or the candle close (from the chart's + menu); checked while ZoroCharts is open.
Notes and limits
- Works on any symbol and timeframe; it only needs candle data.
- It can sit pinned at 0 or 100 for long stretches.
Education only. Not financial advice. Indicators mark what happened on the chart; they do not predict what price will do. Trading futures, forex, crypto and other markets carries a high level of risk and may not be suitable for everyone.