
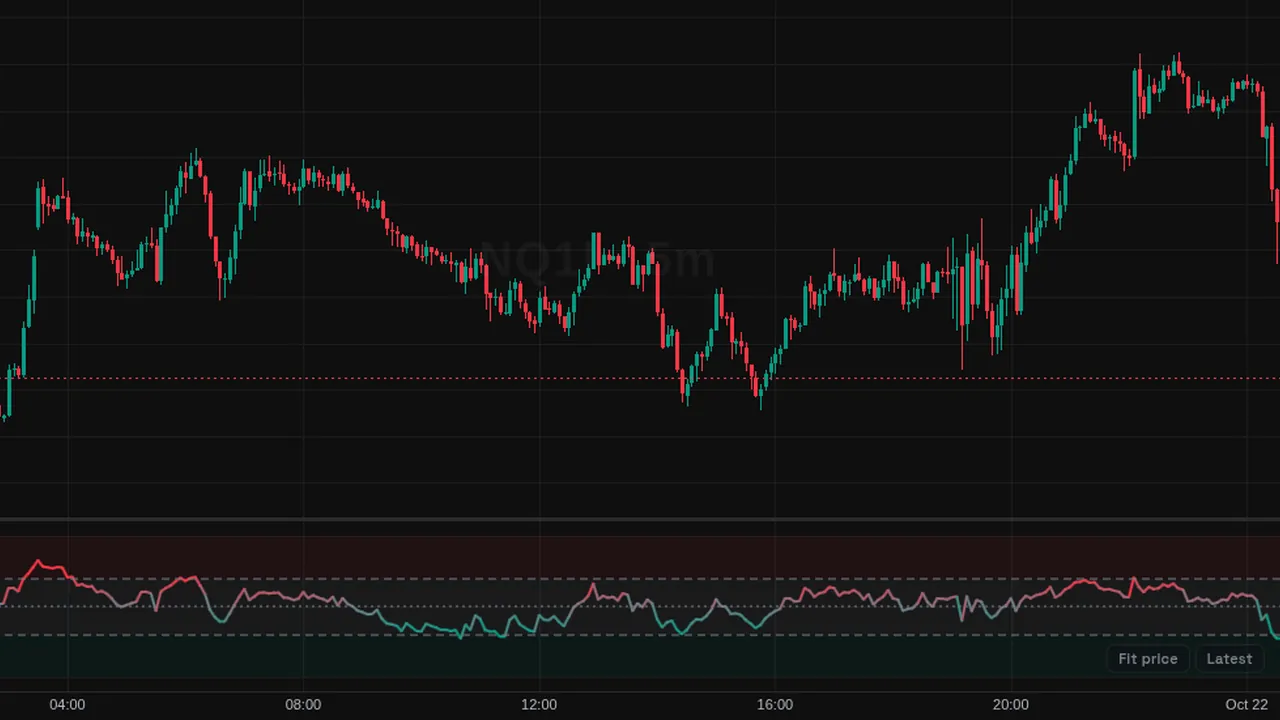
Relative Strength Index: Wilder RSI over 14 bars from 0 to 100, with overbought at 70 and oversold at 30.
In plain English
What it shows
- RSI (relative strength index) is a line from 0 to 100 that compares recent up moves with down moves over a set number of bars.
How traders use it
- Some traders watch the 70 and 30 lines for stretched moves.
- Some watch for the line to disagree with price (divergence).
What it does not tell you
- A high or low reading can last a long time in a strong trend.
- It uses past prices only.
Overview
The Relative Strength Index (RSI) shows momentum on a scale from 0 to 100 in its own pane. Levels sit at 70 (overbought) and 30 (oversold), with a shaded band between.
The line takes the overbought or oversold color as it reaches those zones.
How it works
Over 14 bars, average gains and average losses are smoothed with Wilder's method (RMA). RS = average gain / average loss. RSI = 100 - 100 / (1 + RS).
When gains and losses are equal, RSI is 50.
How to use it
- Some traders watch readings above 70 or below 30 as stretched conditions.
- Use the 50 line to separate up momentum from down momentum.
- Look for divergence: price makes a new high while RSI does not.
- In strong trends RSI can stay in a zone; some traders read that as strength, not a turn.
These are ways some traders read it, for learning. They are not trade signals.
Settings
| Setting | Default |
|---|---|
| Settings | |
| LengthNumber of bars used in the Wilder smoothing of average gains and losses. | 14 |
| SourcePrice series the RSI is calculated on.Options: Close, Open, High, Low, HL2, HLC3, OHLC4, HLCC4 | Close |
| OverboughtLevel above which the oscillator is considered overbought. | 70 |
| OversoldLevel below which the oscillator is considered oversold. | 30 |
| Style | |
| RSIColor of the RSI line at the midline. Toward either threshold it blends into that threshold’s color. | #787b86 |
| OversoldColor of the line and zone shading at and below the oversold level. | #089981 |
| OverboughtColor of the line and zone shading at and above the overbought level. | #f23645 |
| LevelsColor of the overbought, midline and oversold levels. | #787b86 |
| Band FillColor of the fill between the overbought and oversold levels. | #787b861a |
Alerts
You can alert on its line crossing a value or the candle close (from the chart's + menu); checked while ZoroCharts is open.
Notes and limits
- Works on any symbol and timeframe; it only needs candle data.
- Overbought does not mean price must fall.
Education only. Not financial advice. Indicators mark what happened on the chart; they do not predict what price will do. Trading futures, forex, crypto and other markets carries a high level of risk and may not be suitable for everyone.