
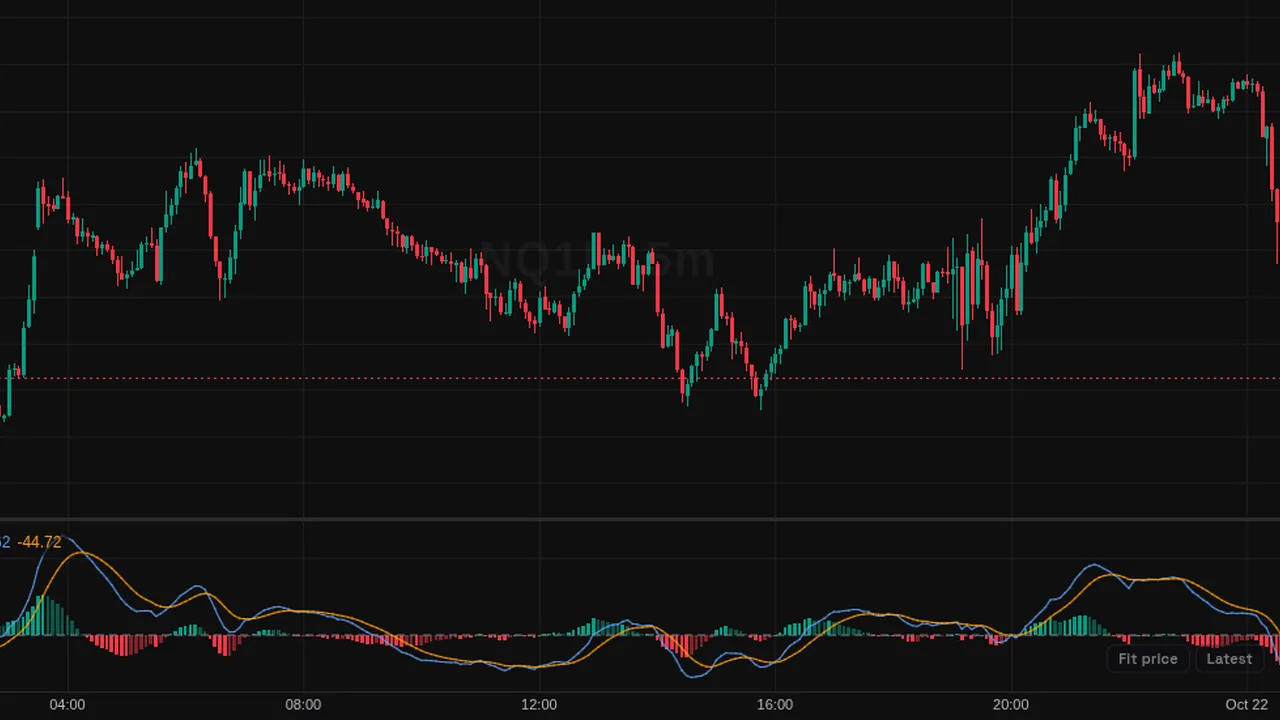
MACD: the 12 EMA minus the 26 EMA, a 9-bar signal line and a histogram showing the gap between the two lines.
In plain English
What it shows
- MACD (moving average convergence divergence) shows the gap between a fast and a slow moving average, a signal line, and a histogram of the difference.
How traders use it
- Some traders watch the lines cross or the histogram change size.
- Some use it to compare momentum between swings.
What it does not tell you
- It lags price, because it is built from averages.
- Crossovers are frequent in sideways markets.
Overview
MACD (Moving Average Convergence Divergence) shows momentum in its own pane. It has a blue MACD line, an orange signal line and a histogram.
Histogram bars are bright when the gap is growing and faded when it is shrinking, green above zero and red below.
How it works
MACD line = EMA(close, 12) - EMA(close, 26). Signal = EMA(MACD, 9). Histogram = MACD - Signal.
Above zero, the fast average is above the slow one.
How to use it
- Some traders watch the MACD line crossing the signal line as a change in momentum.
- Use zero-line crosses to see the fast and slow averages swap places.
- Look for divergence between MACD peaks and price peaks.
- Watch the histogram shrink as an early sign a move is slowing.
These are ways some traders read it, for learning. They are not trade signals.
Settings
| Setting | Default |
|---|---|
| Settings | |
| Fast LengthLength of the fast EMA. | 12 |
| Slow LengthLength of the slow EMA. | 26 |
| Signal SmoothingLength of the EMA applied to the MACD line to obtain the signal line. | 9 |
| SourcePrice series used to compute the fast and slow EMAs.Options: Close, Open, High, Low, HL2, HLC3, OHLC4, HLCC4 | Close |
| Style | |
| MACD LineColor of the MACD line. | #5b9cf6 |
| Signal LineColor of the signal line. | #ff9800 |
| Grow AboveHistogram color when above zero and rising. | #089981 |
| Fall AboveHistogram color when above zero and falling. | #08998180 |
| Grow BelowHistogram color when below zero and rising. | #f2364580 |
| Fall BelowHistogram color when below zero and falling. | #f23645 |
Alerts
You can alert on its line crossing a value or the candle close (from the chart's + menu); checked while ZoroCharts is open.
Notes and limits
- Works on any symbol and timeframe; it only needs candle data.
- Values are in price units, so they are not directly comparable across symbols.
Education only. Not financial advice. Indicators mark what happened on the chart; they do not predict what price will do. Trading futures, forex, crypto and other markets carries a high level of risk and may not be suitable for everyone.