
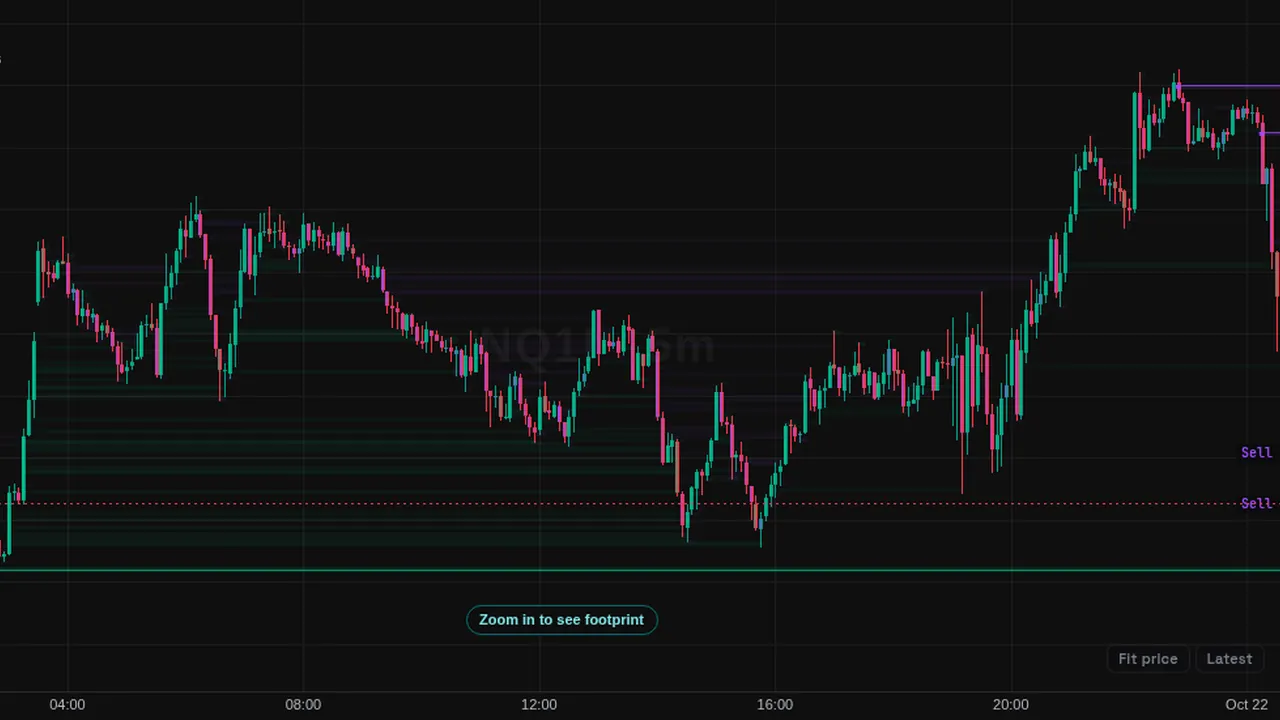
Draws zones where three or more stacked diagonal buy or sell imbalances formed, and extends them right until price trades through.
In plain English
What it shows
- Zones where three or more stacked price rows showed one side clearly outweighing the other (an imbalance). The zone extends right until price trades through it.
How traders use it
- Use the zones as reference areas to study how price behaved when it came back.
- Change the row size to see fewer, wider zones.
What it does not tell you
- It needs per-trade data, so it works on supported symbols only.
- A zone is a record of past trading, not a promise of a reaction.
Overview
Imbalance Zones finds places inside bars where one side clearly outweighed the other for several price rows in a row. Each stack is drawn as a zone that extends to the right until price trades through it, then it fades. Buy imbalance zones are green and sell imbalance zones purple.
How it works
An imbalance is diagonal: buys at a price compared with sells one row lower, and sells compared with buys one row higher. It counts when one side is at least 300% of the other. A zone needs at least 3 such rows stacked together. Rows are 1 tick by default.
Filled zones are faded by default and can be hidden. Order flow comes from recorded futures trades for NQ, ES, YM, GC, SI and CL (micros use their mini contract's flow) and from public exchange trades for crypto.
How to use it
- Some traders watch how price reacts on a return to an unfilled imbalance zone.
- Use it to see where aggressive buying or selling stacked up during a move.
- Some traders compare zones with the footprint cells that made them.
These are ways some traders read it, for learning. They are not trade signals.
Settings
| Setting | Default |
|---|---|
| Imbalance ratio %Diagonal: buys at a price vs sells one row lower (and sells vs buys one row higher). | 300 |
| Stacked rows (at least) | 3 |
| Row size (ticks) | 1 |
| Filled zonesOptions: faded, hidden | faded |
| Buy imbalance zone | #03c988 |
| Sell imbalance zone | #9d4dff |
Notes and limits
- Needs per-trade data; other symbols show a note.
- Larger row sizes find fewer, wider zones.
Education only. Not financial advice. Indicators mark what happened on the chart; they do not predict what price will do. Trading futures, forex, crypto and other markets carries a high level of risk and may not be suitable for everyone.