
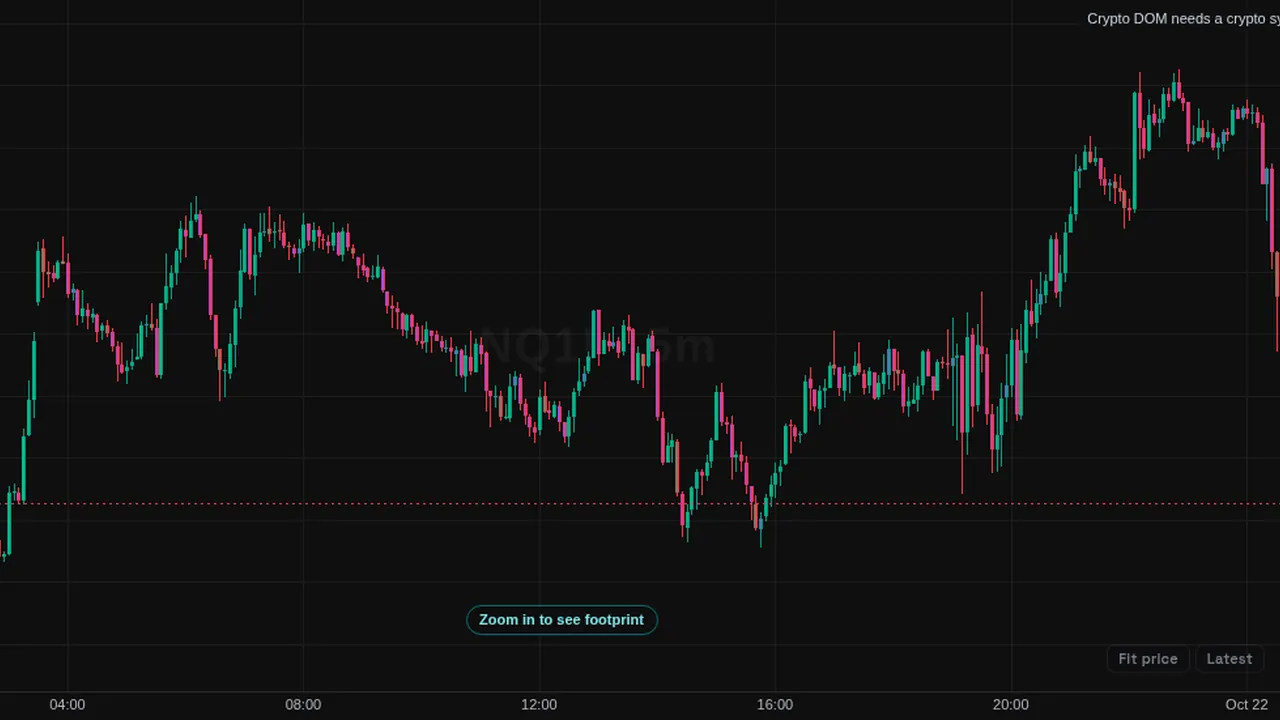
Draws the crypto order book as a heatmap behind the candles: how much size rests at each price, and how it changed over time.
In plain English
What it shows
- The crypto order book painted behind your candles. Brighter bands mean more size waiting at that price. A band that ends means the orders were pulled or traded.
- DOM stands for depth of market.
How traders use it
- Look for large bands near price and watch how price meets them.
- Try the different looks to find one that reads clearly.
What it does not tell you
- Resting orders can be added or pulled at any moment.
- History depends on how long the book has been recorded for that symbol.
Overview
The Crypto DOM Heatmap paints the resting orders of a crypto order book behind your candles. Brighter bands mean more size waiting at that price. When a band ends, the orders there were pulled or filled.
Several looks are available, from a plain heatmap to a deep view with depth bars, wall sizes and tags on big levels that vanished.
How it works
The chart reads the exchange's public order book for the symbol, groups prices into buckets and stores one column per moment. Recorded book history fills in the part of the chart before you opened it.
Walls are the biggest levels on screen (the top 2.5 % of sizes by default) that stayed for at least 12 seconds. Thin levels below a percentile can be hidden to keep the picture clean.
How to use it
- Use it to see where large resting orders sit above and below price.
- Some traders watch how price behaves when it reaches a bright band.
- Watch for walls that disappear before price reaches them (pulled) versus ones that get traded through (filled).
- Combine it with Big Trades to compare resting orders with what actually traded.
These are ways some traders read it, for learning. They are not trade signals.
Settings
| Setting | Default |
|---|---|
| StyleOptions: Deep heatmap (heat + depth + sizes + pulled / filled), Combined (heatmap + depth + walls), Heatmap only, Depth bars only, Walls only | Deep heatmap (heat + depth + sizes + pulled / filled) |
| Show heatmap (Combined) | On |
| Show depth bars (Combined) | On |
| Show walls (Combined) | On |
| Wall threshold (top % of sizes) | 2.5 |
| Wall min lifetime (seconds) | 12 |
| Show wall sizes | On |
| Pulled / filled tags on vanished big levels (Deep) | On |
| Iceberg hint (Deep; minutes this page recorded at 1 s) | On |
| Ask depth colour (Deep) | #8b5cf6 |
| Hide thin levels below (percentile) | 60 |
| Price bucket size (0 = auto) | 0 |
Show all 24 settings
| Setting | Default |
|---|---|
| Book range % | 2 |
| History window (minutes) | 1440 |
| Depth bars width % | 15 |
| Max opacity % | 85 |
| Best bid / ask lines | Off |
| Colour scale (Heatmap only) | On |
| Bid colour | #03c988 |
| Ask colour | #e5484d |
| Filter | |
| Show from colourHide cells below this colour step. The colours of the cells that stay do not change.Options: All, Teal and above, Cyan and above, Yellow and above, Orange and above, Red only | All |
| Min size (coins, 0 = off)Hide resting sizes below this. | 0 |
| Max size (coins, 0 = off)Hide the giant outliers above this. | 0 |
| Top N levels per column (0 = off)Show only the N largest levels at each moment in time. | 0 |
Notes and limits
- Crypto symbols only; for futures use Futures DOM Heatmap (L2).
- History depends on how long the book has been recorded for the symbol.
- Resting orders can be added or pulled at any moment; the heatmap shows what was there, not what will happen.
Education only. Not financial advice. Indicators mark what happened on the chart; they do not predict what price will do. Trading futures, forex, crypto and other markets carries a high level of risk and may not be suitable for everyone.