
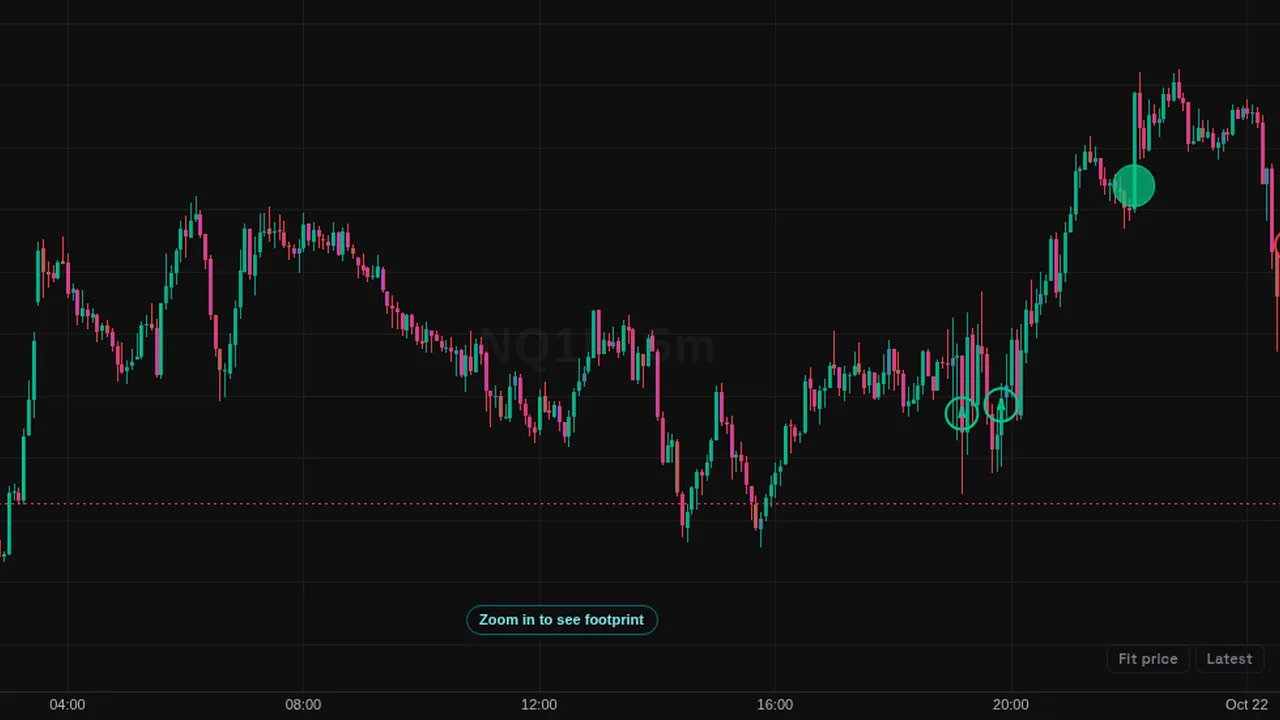
Marks the largest aggressive orders from public crypto exchange trades with bubbles, buyers above and sellers below, with absorption and swept levels.
Overview
Big Trades marks only the orders that stand out. Each marker is a buy (green) or sell (red) bubble placed at the order's average price. Bigger and brighter markers mean higher impact. Hover or tap a marker for its details.
When a big order came and price did not follow it, the marker is a hollow ring with an A for absorption. The price range an order swept can also be shown.
How it works
Consecutive same-side fills within a short burst (150 ms gap, up to 4 ticks of price walk) are joined into one parent order with its total size and average price. Optionally, same-side orders at one price can be summed over a time window, so a big resting order filled by many small ones shows as one marker.
In Automatic mode the size threshold is set so that about 15 markers show per 6.5-hour session at Medium intensity (40, 25 or 8 at Very low, Low and Strong). Manual mode uses your own min and max size. Impact combines size against normal, levels swept, and what price did in the next 60 seconds. Absorption means price moved 0.2 ATR or less in the order's direction. Order flow comes from public exchange trades for crypto.
How to use it
- Some traders watch where large orders appeared near highs, lows or key levels.
- Use the absorption marks to see big orders that price did not follow.
- Some traders run two copies with different size bands to separate sizes.
- Use the hover card to read each order's size and fills.
These are ways some traders read it, for learning. They are not trade signals.
Settings
| Setting | Default |
|---|---|
| Data | |
| Aggregate fills into one orderConsecutive same-side prints in a short burst count as ONE order. | On |
| Burst gap (ms)Largest pause between two fills of one order. | 150 |
| Price walk (ticks)A sweep through up to this many ticks counts as one order. | 4 |
| Also count fills at one price over (s)Adds up same-side fills at the same price over this many seconds, so a big order filled by many small ones shows. 0 = off. | 0 |
| Filter | |
| FilterOptions: Automatic, Manual | Automatic |
| IntensityAbout 40 / 25 / 15 / 8 markers per session. Very low = more markers.Options: Very low, Low, Medium, Strong | Medium |
| Min size (contracts) | 0 |
| Max size (0 = no limit)Run two copies with different bands. | 0 |
| Plot | |
| MarkerOptions: Circle, Square, Diamond, Text only | Circle |
Show all 18 settings
| Setting | Default |
|---|---|
| Size scale (SD)Higher = markers grow more slowly with impact. | 1 |
| Fill opacity | 0.7 |
| Buyers (hit the ask) | #03c988 |
| Sellers (hit the bid) | #f23645 |
| Show size | Off |
| Show fills count | Off |
| Mark absorption (A)Big order, but price did not follow it in the next minute. | On |
| Show levels swept | On |
| Extend levels (bars, 0 = off)A faint line from the biggest orders to the right. | 0 |
Notes and limits
- On futures charts use Big Trades (L2); a saved futures chart that still holds this one is switched to it automatically. Crypto charts keep this one.
- Needs per-trade data; other symbols show a note.
- Joining fills into one order is an estimate based on timing and price.
Education only. Not financial advice. Indicators mark what happened on the chart; they do not predict what price will do. Trading futures, forex, crypto and other markets carries a high level of risk and may not be suitable for everyone.