
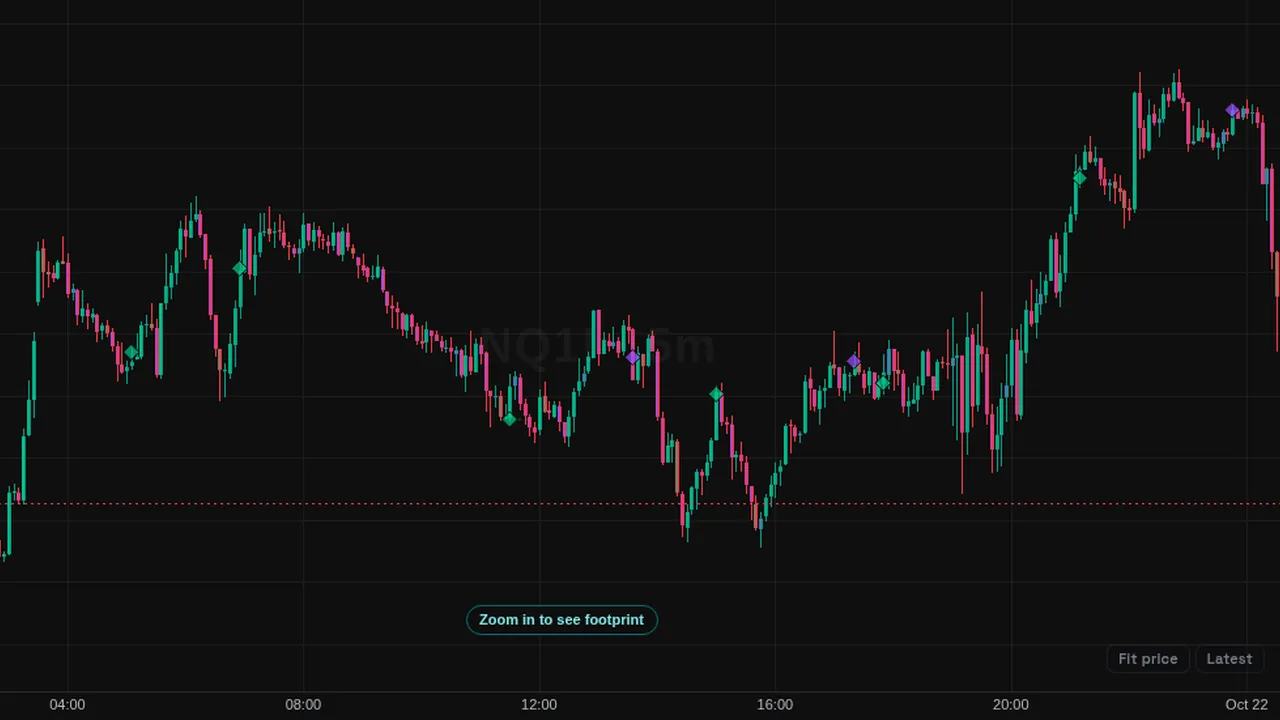
Flags bars where heavy aggressive volume hit one price while price did not move, and extends that level until a bar closes through it.
In plain English
What it shows
- Marks bars where heavy aggressive volume hit one price but price barely moved, and extends that level right until a bar closes through it.
How traders use it
- Look at the marked levels and see how price reacted when it returned.
- Hide broken levels to keep the chart clean.
What it does not tell you
- It needs per-trade data, so it works on supported symbols only.
- It flags past bars. It does not say a level will hold.
Overview
Absorption marks bars where a lot of aggressive volume traded but price did not travel far, and the bar closed against the aggressive side. A small marker sits at the absorbed price, and a level line extends to the right until a bar closes beyond it.
Levels where sellers were absorbed (support) are green; levels where buyers were absorbed (resistance) are purple. Broken levels stay on the chart faded, or can be hidden.
How it works
A bar qualifies when its volume is at least 1.2 times the average of the previous 30 one-minute bars, its volume per tick of range is at least 1.3 times average, and its delta is at least 8% of the bar's volume in one direction while the bar closes the other way.
A level counts as broken when a bar closes beyond it by 2 ticks. Order flow comes from recorded futures trades for NQ, ES, YM, GC, SI and CL (micros use their mini contract's flow) and from public exchange trades for crypto.
How to use it
- Some traders watch absorption levels as places where one side met resistance.
- Use the faded broken levels to review which absorption levels held.
- Some traders combine it with Big Trades to see large orders at the same prices.
These are ways some traders read it, for learning. They are not trade signals.
Settings
| Setting | Default |
|---|---|
| Volume at least (x average)Against the previous 30 one-minute bars. | 1.2 |
| Volume per tick of range at least (x average)A lot traded for the distance price covered. | 1.3 |
| Delta at least (% of the bar volume)The aggressive side was clearly one way, yet the bar closed the other way. | 8 |
| Broken when a bar closes beyond by (ticks) | 2 |
| Show broken levels (faded; off = hide them) | On |
| Labels | On |
| Sellers absorbed (support) | #03c988 |
| Buyers absorbed (resistance) | #9d4dff |
Notes and limits
- Needs per-trade data; other symbols show a note.
- It flags past bars; it does not say a level will hold.
Education only. Not financial advice. Indicators mark what happened on the chart; they do not predict what price will do. Trading futures, forex, crypto and other markets carries a high level of risk and may not be suitable for everyone.