
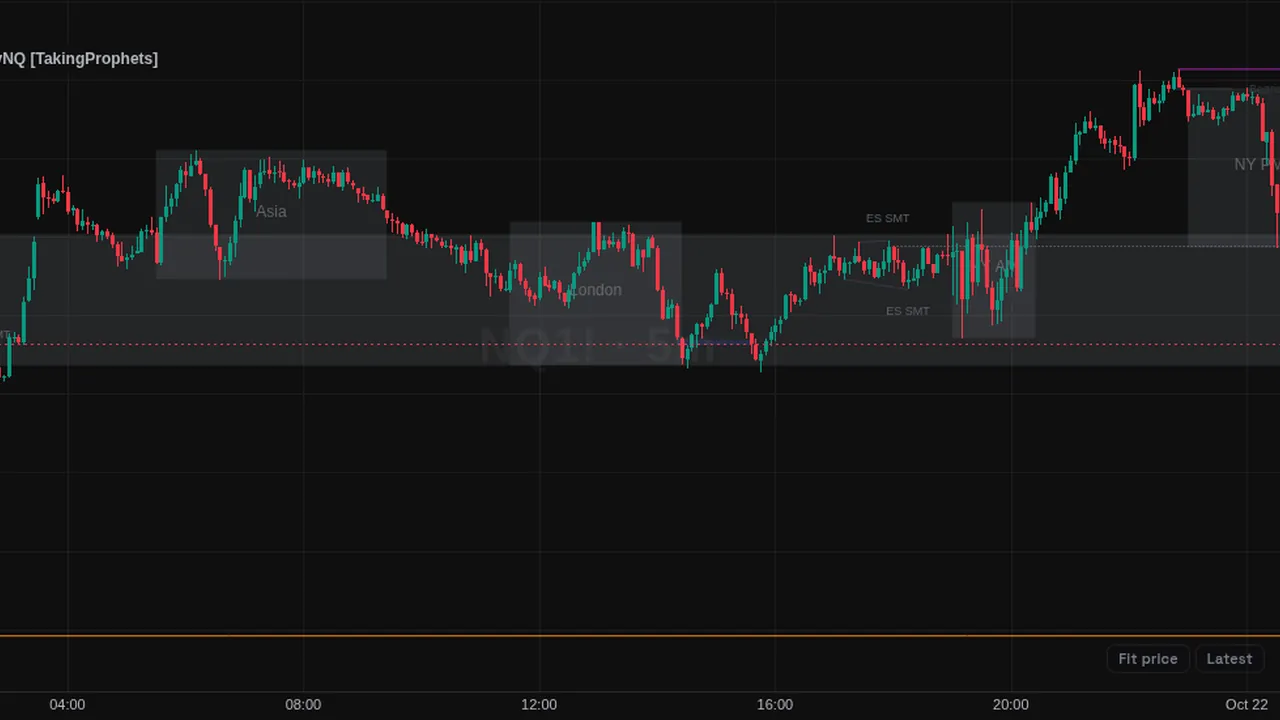
ICT toolkit: inversion FVGs, CISD lines, HTF gaps, weekly, daily and session highs and lows, session boxes and SMT against a paired symbol.
Overview
This community script gathers ICT reference points in one overlay. It draws inversion fair value gaps after liquidity sweeps, CISD lines, and the nearest unmitigated higher-timeframe gap on each side. It marks previous week and day highs and lows, Asia and London highs and lows, the all-time high, and the 8:30 AM New York open.
It also shades Asia, London, NY AM and NY PM sessions, and draws SMT divergence lines between the chart and a correlated symbol.
How it works
After a sweep, the most recent qualifying FVG that price closes through is drawn as an inversion box; pending gaps can be shown first and are removed if they never invert. The open of the delivering leg is tracked, and a close back through it prints a CISD line. A CISD whose implied stop is broken is removed.
Higher-timeframe gaps come from two timeframes chosen from the chart interval. Levels close to each other (within 8 ticks by default) share one label.
SMT pairs are automatic for NQ-ES, MNQ-MES, YM-ES, MYM-MES, GC-SI and MGC-SIL, or manual. A sensitivity setting sets swing size for the three-point pattern, and an optional mode adds gap divergence.
How to use it
- Use the level labels to see where key highs and lows sit before the session opens.
- Some traders watch inversion FVGs and CISDs that form after a sweep of a marked level.
- Use session boxes to see which session made the high or low of the day.
- Watch SMT lines when the chart and its paired market disagree at a swing.
These are ways some traders read it, for learning. They are not trade signals.
Settings
| Setting | Default |
|---|---|
| Confluences | |
| Inversion FVGs | On |
| Max | 2 |
| Fair Value Gaps | Off |
| CISDs | On |
| Max | 2 |
| Bullish | color.black |
| Bearish | color.black |
| Labels | On |
| High Timeframe Gaps | |
| Show Gaps | On |
| Bullish | #787b8633 |
Show all 49 settings
| Setting | Default |
|---|---|
| Bearish | #787b8633 |
| Border | Off |
| Label | #5d606b |
| Key Liquidity | |
| PWH / PWL | On |
| Label | On |
| PDH / PDL | On |
| Label | On |
| Asia H / L | On |
| Label | On |
| London H / L | On |
| Label | On |
| All-Time High | On |
| Label | On |
| Merge Labels Within (Ticks) | 8 |
| Low Resistance Liquidity | |
| Enable | On |
| SensitivityOptions: Sensitive, Medium, Strict | Medium |
| Bullish | color.black |
| Bearish | color.black |
| Label SizeOptions: Tiny, Small, Normal, Large | Tiny |
| Key Opens | |
| 8:30 AM Open | On |
| Label | On |
| Killzones / Sessions | |
| Borders | Off |
| Transparency | On |
| Labels | On |
| Asia | On |
| London | On |
| NY AM | On |
| NY PM | On |
| Max Sessions | 5 |
| SMT Divergence | |
| Enable | On |
| Pivot StrengthOptions: Sensitive, Normal, Strict | Normal |
| Max Visible | 3 |
| Live Tracking | On |
| Gap Divergence | On |
| Correlated AssetOptions: Automatic, Manual | Automatic |
| Bullish | color.black |
| Bearish | color.black |
| Labels | On |
| Show Symbol | On |
Notes and limits
- Session times are New York time; session labels show on 15-minute and lower charts.
- SMT needs data for the correlated symbol and is made for the futures and metal pairs listed.
- The script has no alert conditions.
Education only. Not financial advice. Indicators mark what happened on the chart; they do not predict what price will do. Trading futures, forex, crypto and other markets carries a high level of risk and may not be suitable for everyone.