
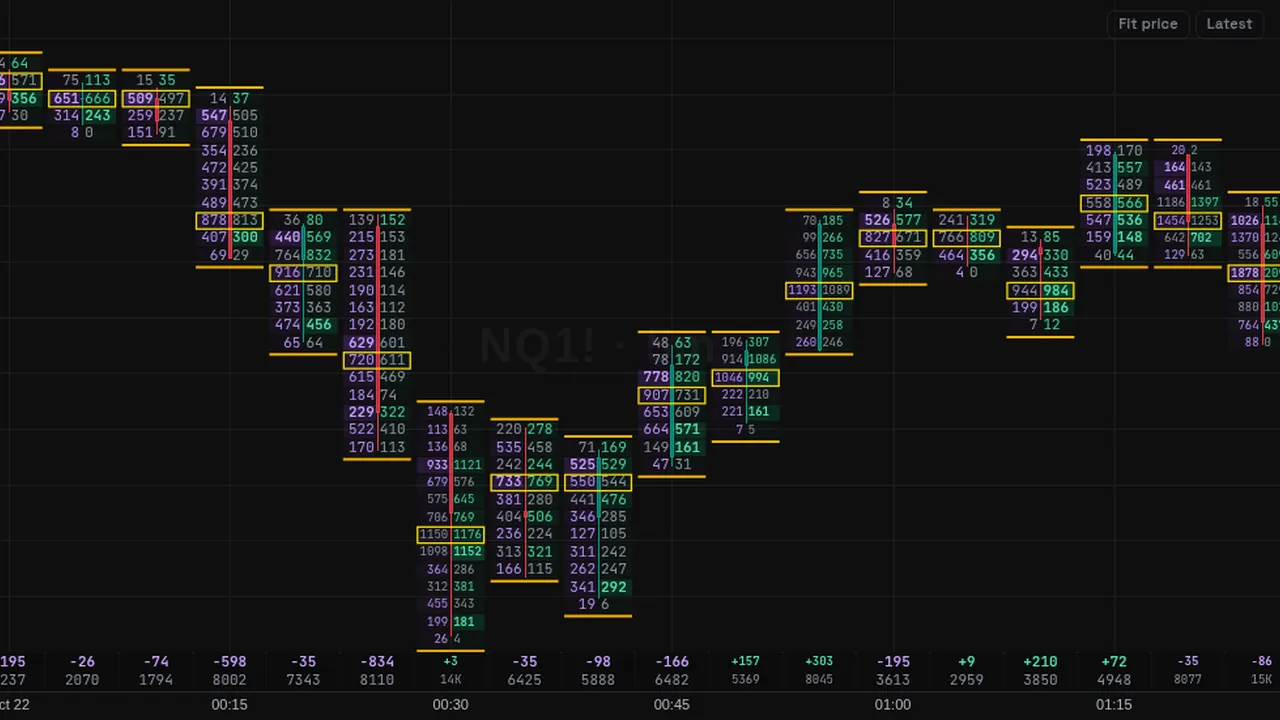
Splits every candle by price and shows the volume sold at the bid and bought at the ask at each price, with imbalances and the POC.
In plain English
What it shows
- Each candle split by price, with the volume traded at the bid (sellers) and at the ask (buyers) on every row.
- Order flow tools are a Pro feature.
How traders use it
- Look for price rows where one side clearly outweighed the other (an imbalance).
- Compare the totals with how the candle closed.
What it does not tell you
- It needs per-trade data and works on supported symbols only.
- It shows what already traded, not what will trade next.
Overview
Footprint (bid x ask) opens each candle up into price rows. Each row shows the volume that sold into the bid and the volume that bought at the ask at that price. The busiest price in the bar, its point of control, is boxed, and diagonal imbalances are highlighted.
You can switch the cells to show delta (ask minus bid) or total volume instead. The cells appear when bars are at least 44 pixels wide; zoomed out, the chart falls back to candles.
How it works
Every trade is tagged by its aggressor: a buyer lifting the ask or a seller hitting the bid. Trades are added up per price row for each bar. Order flow comes from recorded futures trades for NQ, ES, YM, GC, SI and CL (micros use their mini contract's flow) and from public exchange trades for crypto.
An imbalance compares the ask volume at one price with the bid volume one row below (and the bid volume with the ask volume one row above). It is flagged when one side is at least 300% of the other by default. The row size can be set as a multiple of the base step.
How to use it
- Some traders look at which side was more aggressive at the high or low of a bar.
- Use the boxed POC to see where most of a bar's volume traded.
- Some traders watch stacked imbalances as areas where one side dominated.
- Use delta mode to see the net buying or selling at each price.
These are ways some traders read it, for learning. They are not trade signals.
Settings
| Setting | Default |
|---|---|
| Cells showbidask = volume at the bid x volume at the ask per price row.Options: bidask, delta, volume | bidask |
| Row size (x the base step) | 1 |
| Imbalance at (%)Diagonal: ask at a price vs bid one row below (and bid vs ask one row above). | 300 |
| Show cells from bar width (px) | 44 |
| Buy colour | #089981 |
| Sell colour | #f23645 |
Notes and limits
- On futures charts use Footprint (L2); a saved futures chart that still holds this one is switched to it automatically. Crypto charts keep this one.
- Needs per-trade data; charts without it show a note instead.
- In bar replay only data complete at the replay time is used.
- Footprint cells need room; zoom in to see the numbers.
Education only. Not financial advice. Indicators mark what happened on the chart; they do not predict what price will do. Trading futures, forex, crypto and other markets carries a high level of risk and may not be suitable for everyone.