
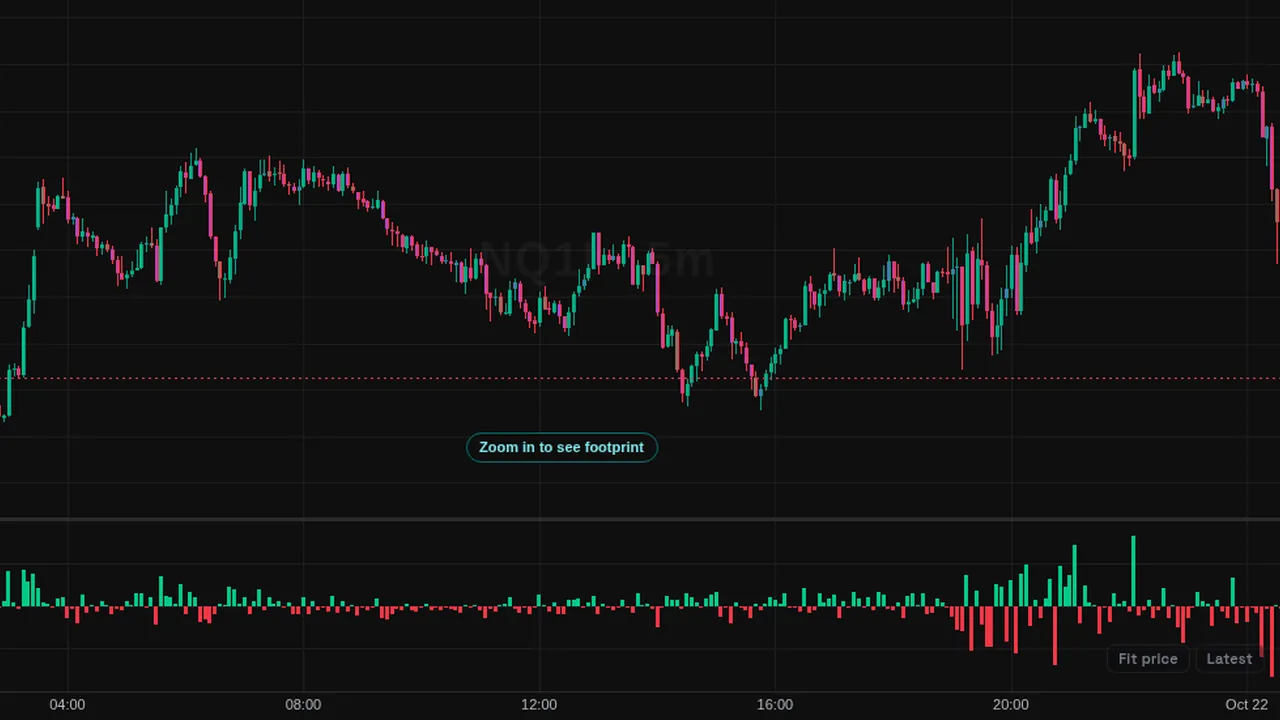
Plots each bar's delta, the volume bought at the ask minus the volume sold at the bid, as a histogram in a lower pane.
Overview
Delta (trades) draws one histogram bar per candle in its own pane. A bar above zero means more volume bought at the ask than sold at the bid during that candle; below zero means the reverse. Positive bars are green and negative bars red by default.
How it works
Each recorded trade is tagged by its aggressor side. For every chart bar, the indicator adds up the buy volume and the sell volume and plots buy minus sell. Order flow comes from recorded futures trades for NQ, ES, YM, GC, SI and CL (micros use their mini contract's flow) and from public exchange trades for crypto.
The trades are stored as 1-minute footprint bars and re-aggregated to your chart's timeframe.
How to use it
- Some traders compare the size of delta with the size of the candle.
- Use it to see whether a push higher came with net buying, or not.
- Some traders watch for a large delta that price did not follow.
- Use it next to Cumulative Delta to see both the bar and the running total.
These are ways some traders read it, for learning. They are not trade signals.
Settings
| Setting | Default |
|---|---|
| Positive | #03c988 |
| Negative | #f23645 |
Notes and limits
- On futures charts use Delta (L2); a saved futures chart that still holds this one is switched to it automatically. Crypto charts keep this one.
- Needs per-trade data; other symbols show a note.
- In bar replay only bars complete at the replay time are used.
Education only. Not financial advice. Indicators mark what happened on the chart; they do not predict what price will do. Trading futures, forex, crypto and other markets carries a high level of risk and may not be suitable for everyone.