
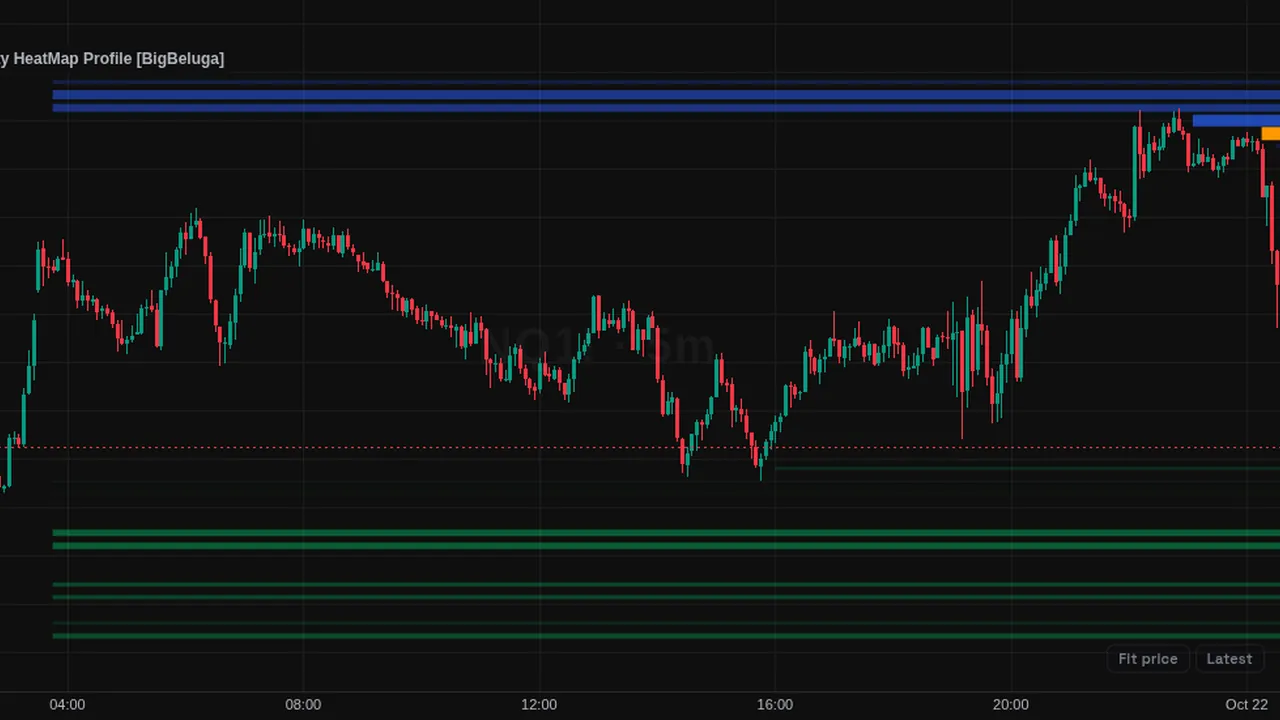
Heat map of likely stop-loss liquidity above and below price, with a side histogram and a highlighted peak-liquidity level.
Overview
This community script estimates where stop orders may be resting above recent highs and below recent lows, and paints those areas as horizontal heat lines across the chart. Brighter, thicker lines mark price levels where more estimated liquidity has built up.
To the right of the last candle it draws a profile: one bar per price row, sized by the liquidity collected there, with a percentage label. The row holding the most liquidity is drawn in its own color (orange by default) as a point of control.
How it works
Over the last few hundred bars (Calculated Bars, 300 by default) the script looks for new short-term highs and lows. At each one it projects a level a little beyond the candle, pushed further out when recent volume is high relative to the window (it uses a 10-bar volume sum and a small ATR step). These levels are stored and removed once price trades through them.
On the last bar the surviving levels are grouped into price rows (Resolution, 50 by default) and their volume is summed per row. Rows above price use the sell liquidity color, rows below use the buy liquidity color, with a gradient from faint to strong.
How to use it
- Some traders watch the brightest rows as areas price may be drawn toward to trigger stops.
- Use the profile to compare how much estimated liquidity sits above versus below the current price.
- Watch the highlighted peak row as the single level with the largest stored liquidity in the window.
- Notice when heat lines disappear: it means price has traded through that level.
These are ways some traders read it, for learning. They are not trade signals.
Settings
| Setting | Default |
|---|---|
| Calculated Bars | 300 |
| Profile | |
| Profile | On |
| Resolution | 50 |
| Sell Liquidity | color.blue |
| Buy Liquidity | color.lime |
| Max Point Liquidity | color.orange |
Notes and limits
- The liquidity is an estimate built from candle highs, lows, volume and ATR. It does not read the order book.
- It needs volume data; on symbols with no volume the levels lose their sizing.
- The profile is rebuilt on the last bar, so its shape changes as new bars arrive.
- It works on any market and timeframe that has volume.
Education only. Not financial advice. Indicators mark what happened on the chart; they do not predict what price will do. Trading futures, forex, crypto and other markets carries a high level of risk and may not be suitable for everyone.