
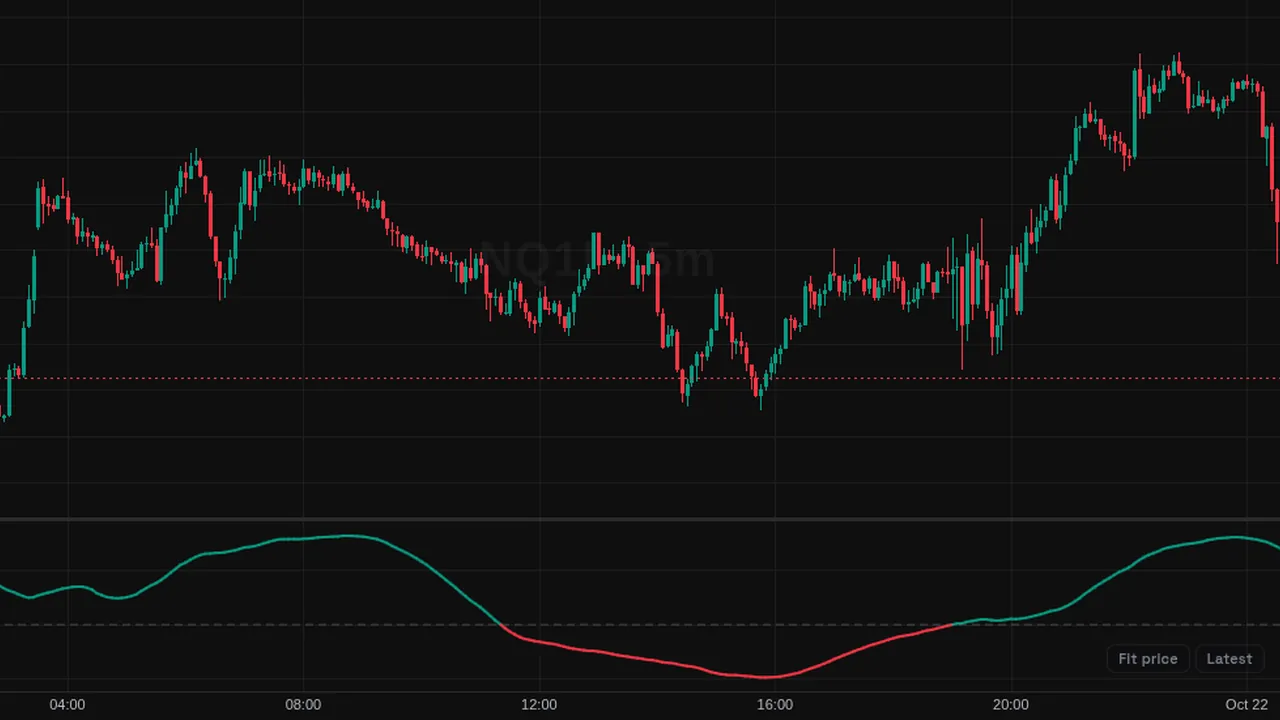
Linear regression slope: the slope of a straight-line fit over the last 100 bars, green when rising and red when falling.
Overview
The Linear Regression Slope shows how steep the recent trend is, in its own pane. Above zero the fitted line points up; below zero it points down.
Colors show whether the slope is rising or falling from the previous bar.
How it works
On each bar a least-squares line is fitted to the last N values (100 by default). The plotted value is that line's slope: price change per bar.
The larger the absolute value, the steeper the fitted trend.
How to use it
- Use zero crossings to see when the fitted trend flips direction.
- Some traders watch a falling slope while price rises as a sign the trend is tiring.
- Use shorter lengths for swings and longer ones for the main trend.
- Compare the slope across symbols with care, since it is in price units.
These are ways some traders read it, for learning. They are not trade signals.
Settings
| Setting | Default |
|---|---|
| Settings | |
| LengthNumber of bars used to fit the linear regression. | 100 |
| SourcePrice series the regression is fitted to.Options: Close, Open, High, Low, HL2, HLC3, OHLC4, HLCC4 | Close |
| Style | |
| RisingColor of the slope line while the fit slopes upward. | #089981 |
| FallingColor of the slope line while the fit slopes downward. | #f23645 |
| Slope LineColor of the slope line while the fit is flat. | #787b86 |
Alerts
You can alert on its line crossing a value or the candle close (from the chart's + menu); checked while ZoroCharts is open.
Notes and limits
- Works on any symbol and timeframe; it only needs candle data.
- Values are in price per bar, so they differ by symbol.
Education only. Not financial advice. Indicators mark what happened on the chart; they do not predict what price will do. Trading futures, forex, crypto and other markets carries a high level of risk and may not be suitable for everyone.