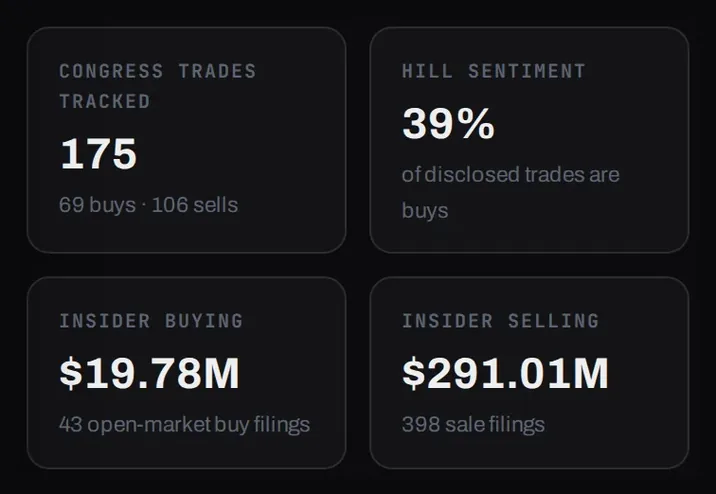
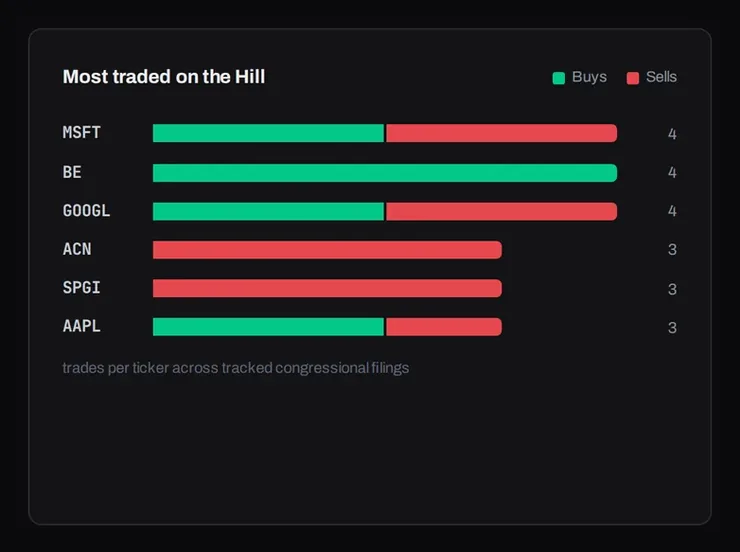
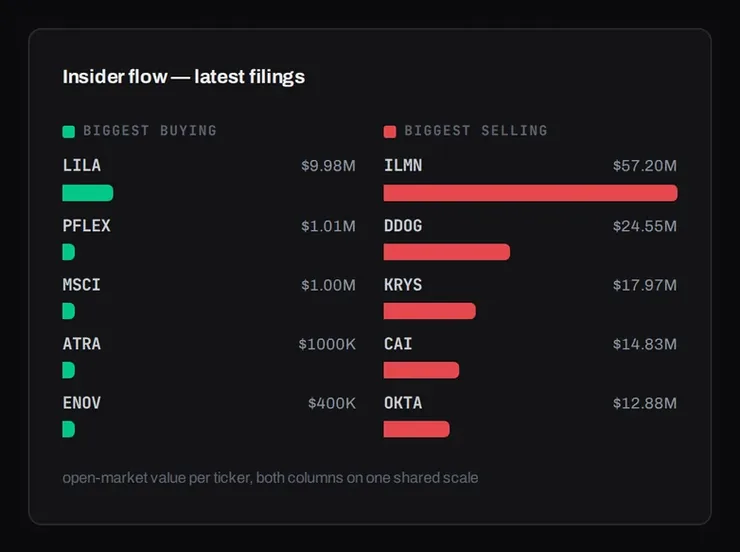
The Smart Money page: stat tiles, the Most traded on the Hill chart and the Insider flow chart.
Congressional trade disclosures and SEC insider filings, parsed from official government records. Searchable, charted, and linked to the official filing.
Public-record context, not a signal service. Education only. Not financial advice.
What’s on the Smart Money Desk
The raw filings sit on government websites, scattered and hard to search. The desk turns them into something a trader can scan.
Stat tiles at the top of the Smart Money page.
01 / 07
Stat tiles
Four numbers at the top of the page: congressional trades tracked, Hill sentiment, insider buying and insider selling by dollar value.
How it works
Hill sentiment is the share of tracked congressional trades that are buys. Insider buying counts open-market purchase filings; insider selling counts sale filings.
Most traded on the Hill chart.
02 / 07
Most traded on the Hill
The tickers that show up most often in congressional disclosures, with each bar split into buys and sells.
How it works
Counts trades per ticker across the tracked congressional filings. Green is buys, red is sells.
Insider flow chart: biggest buying and biggest selling.
03 / 07
Insider buying vs. selling
The biggest insider buying and selling by dollar value, side by side.
How it works
Open-market value per ticker from the latest insider filings. Both columns use one shared scale, so the bar lengths compare directly.
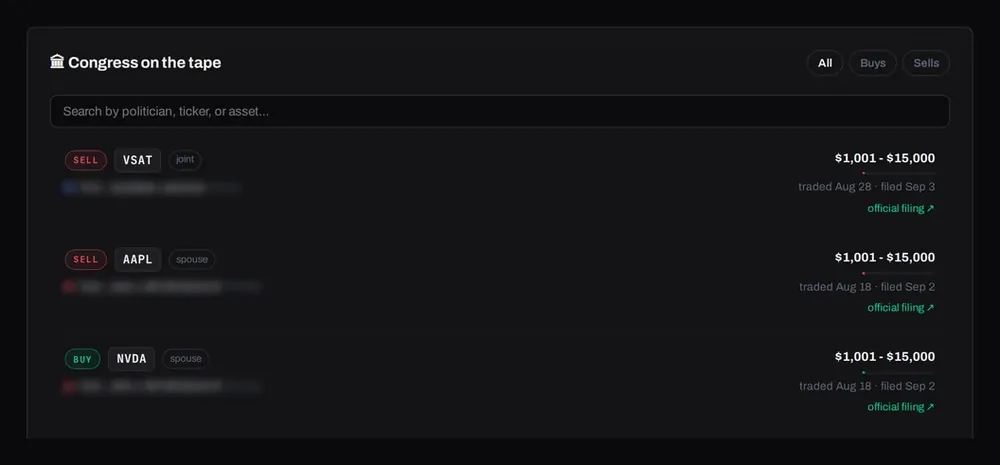
Congress on the tape. Names blurred for this page.
04 / 07
Congress on the tape
Disclosed trades by US senators and representatives: who traded, what, the amount range, and when it was traded and filed.
How it works
Rows come from Senate and House disclosure records. Each shows the owner type (self, spouse or joint), the disclosed amount range, and both the trade date and the filing date.
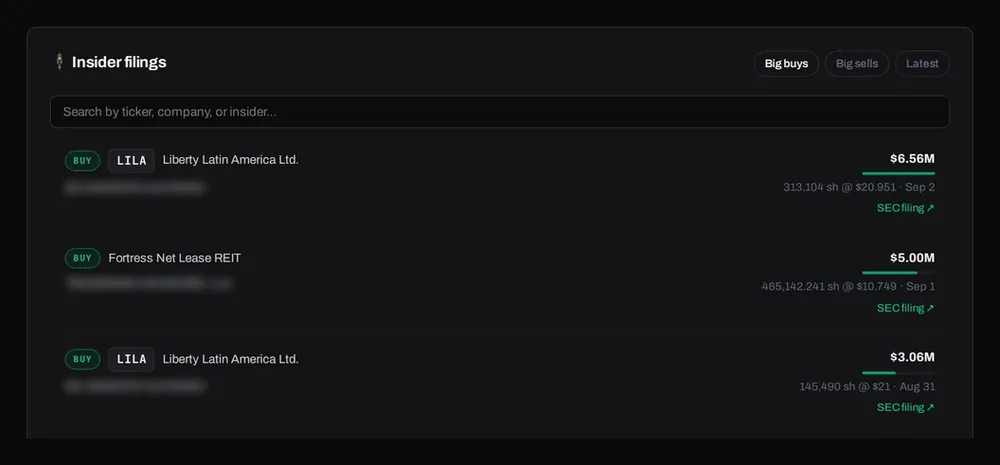
Insider filings. Names blurred for this page.
05 / 07
Insider filings
SEC filings from executives and directors, with open-market buys surfaced first.
How it works
Switch between big buys, big sells and the latest filings. Each row shows the dollar value, the share count and price, and the filing date.
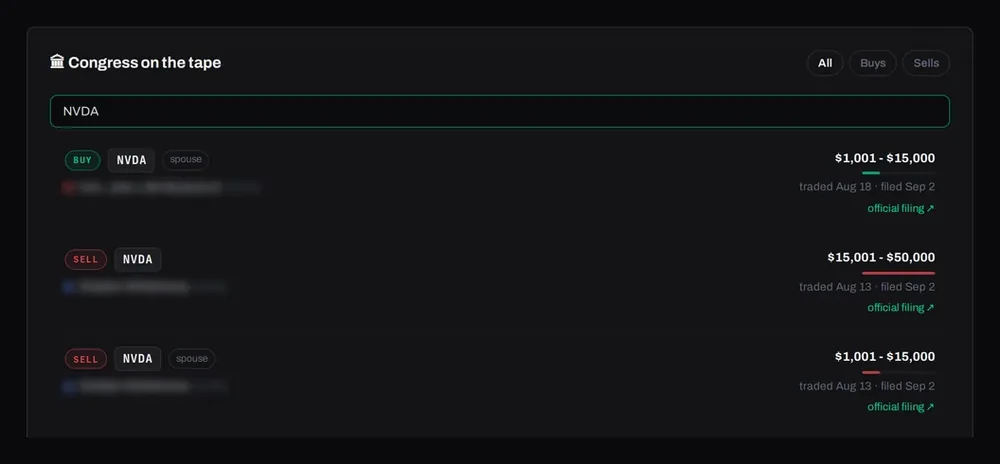
Searching the Congress panel for one ticker.
06 / 07
Search everything
Filter by politician, executive, ticker or company. Show buys only, sells only, or the full tape.
How it works
Each panel has its own search box and filter buttons. The search matches as you type.
Amount range, dates and the official filing link on one row.
07 / 07
Link to the source filing
Rows link to the official filing they came from, the actual Senate, House or SEC document, so you can check it yourself.
How it works
Congressional trades are due within 45 days of the trade (some are filed late), so each row shows both dates. Amounts are the disclosed ranges, not exact figures.
Where the filings come from
Parsed from official government records.
1
Official records
SEC EDGAR for insider filings, Senate eFD and the House Clerk for congressional disclosures.
2
Parsed into rows
A public-domain dataset published by LuxAlgo, parsed from those records, one row per trade or filing.
3
Linked back
Rows keep their link to the original filing.
How to read a filing
Context, honestly framed. A spouse’s structured note is not a CEO’s cash buy. Tap a step, or let it play.
Filings are context, not signals. They do not say what price will do.
Questions
Is this a signal service?
No. It is public-record context, and the page says so. Use it to understand who is trading what, not as a trade trigger.
Where does the data come from?
From official records (SEC EDGAR, Senate eFD and the House Clerk), via LuxAlgo’s public-domain dataset parsed from those filings. Rows link to the official filing they came from.
Why are some congressional trades filed weeks later?
Members of Congress are due to file within 45 days of a trade, and some file later. Each row shows both the trade date and the filing date so you can see the gap.
Can I search for one stock or one person?
Yes. Search by politician, executive, ticker or company, and filter to buys, sells or the full list.
Which plan includes it?
The Smart Money Desk is part of the Pro plan. Members on other plans can see the page and upgrade from it.
Follow the filings
Add congressional and insider filings to your routine, with a link to the source filing.