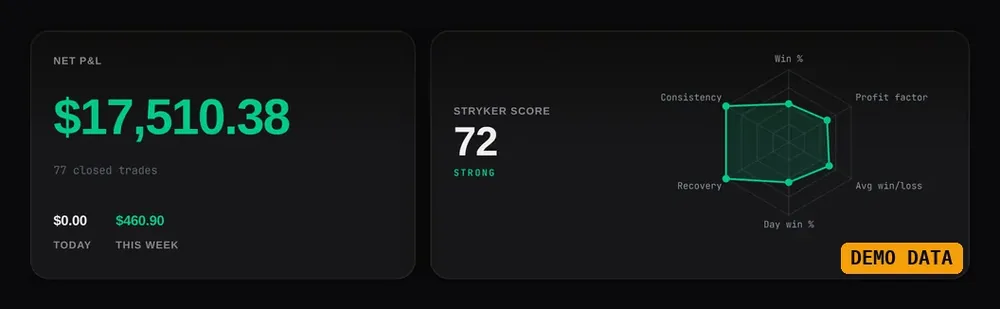
Demo data. The journal dashboard: net P&L and the Stryker Score.
Log the trade, name the model, record the outcome. Then review whether you executed or improvised, with a dashboard, calendar, analytics, a rule-based coach and prop-firm tools, all from your own entries.
Every number in these screenshots is demo data. Education only. Not financial advice.
What’s in the journal
Real screens from the journal, filled with its built-in demo data. Scroll through, or jump to one.
Demo data. Net P&L and the Stryker Score.
01 / 09
Dashboard
Net P&L, today and this week at the top, with the Stryker Score: one number that summarises how your journal reads, drawn as a radar so you can see which side pulls it down.
How it works
Everything is computed from the trades you have logged or imported. A range selector scopes every dashboard widget.
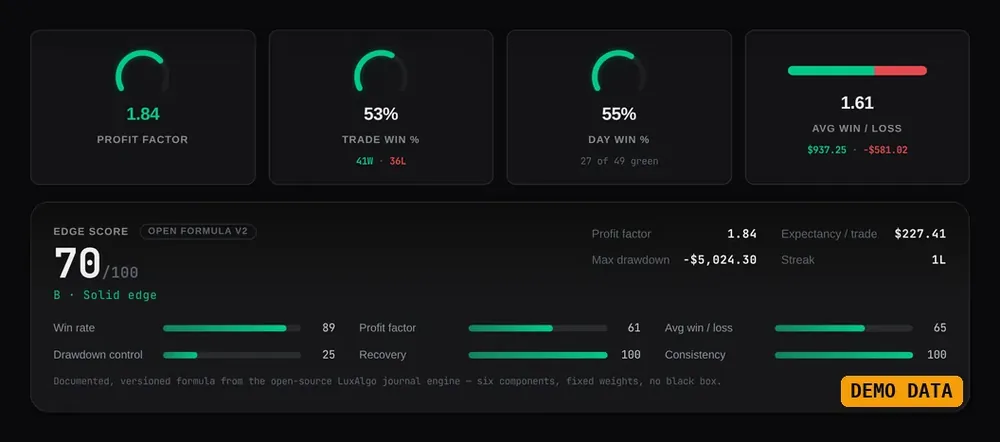
Demo data. Stat tiles and the edge panel.
02 / 09
Stat tiles and edge
Win rate, profit factor, average win against average loss and more, each with a small gauge, plus an edge panel that reads your closed trades as a whole.
How it works
The tiles recalculate whenever you add, edit or import a trade.
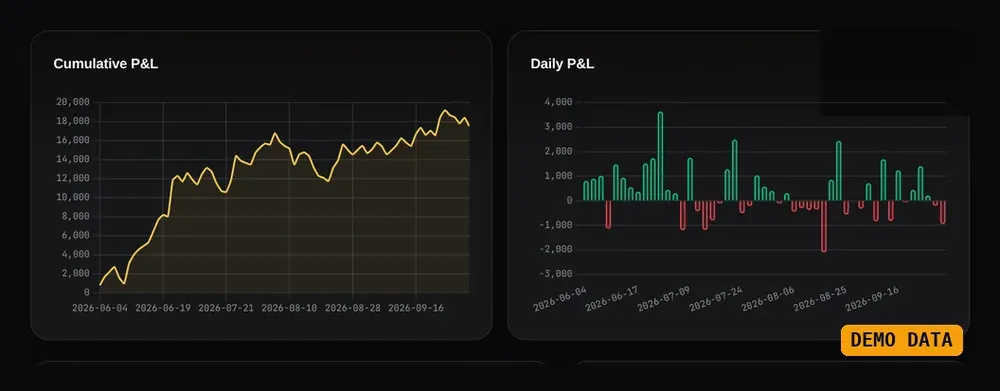
Demo data. Cumulative and daily P&L.
03 / 09
Equity and daily P&L charts
Your cumulative P&L curve next to daily P&L, so a drawdown or one outsized day stands out straight away.
How it works
Both charts are drawn from your own closed trades.
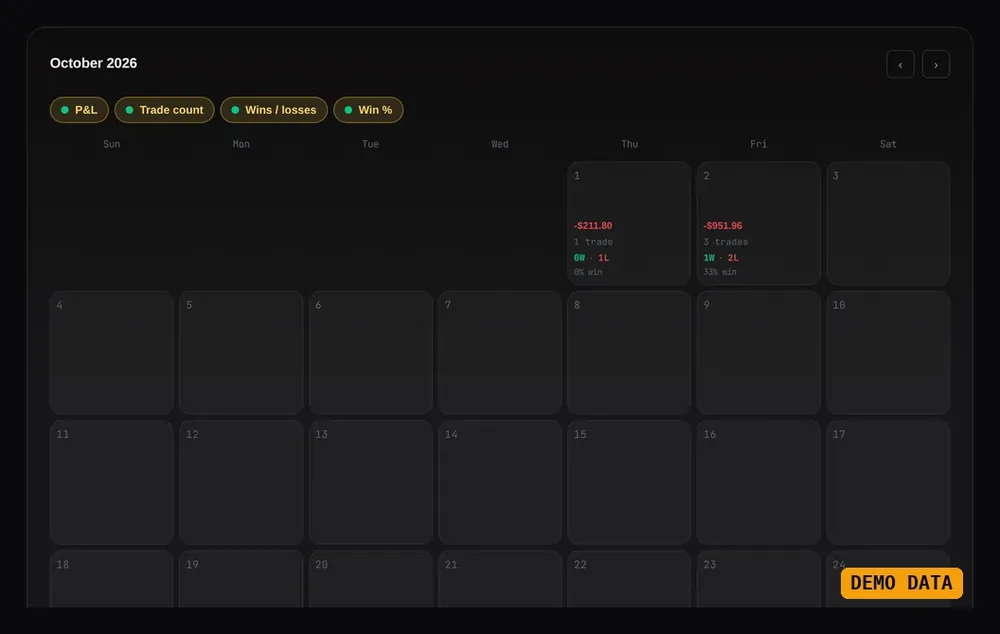
Demo data. The P&L calendar.
04 / 09
P&L calendar
Every trading day on a month grid. Switch what each day shows: P&L, trade count, wins and losses, or win rate.
How it works
Step back and forward a month. Days with no trades stay blank.
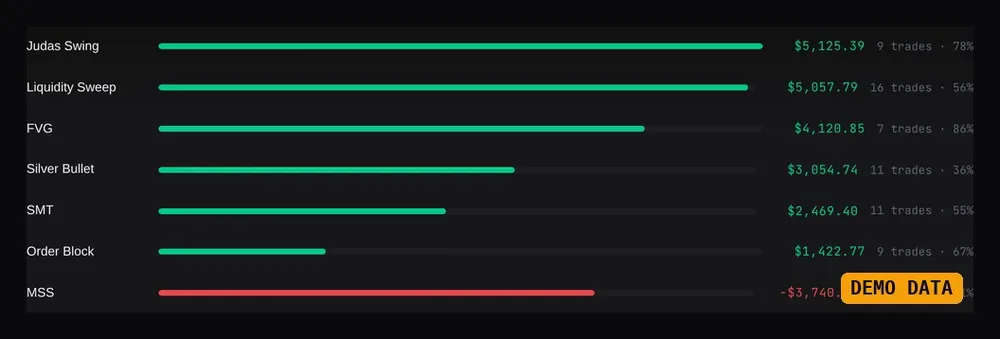
Demo data. P&L by setup.
05 / 09
Analytics by setup
Break results down by setup, session, day of week, instrument, direction and account, and see which of your setups made money and which lost it.
How it works
Name the setup when you log a trade and it appears in the breakdown.
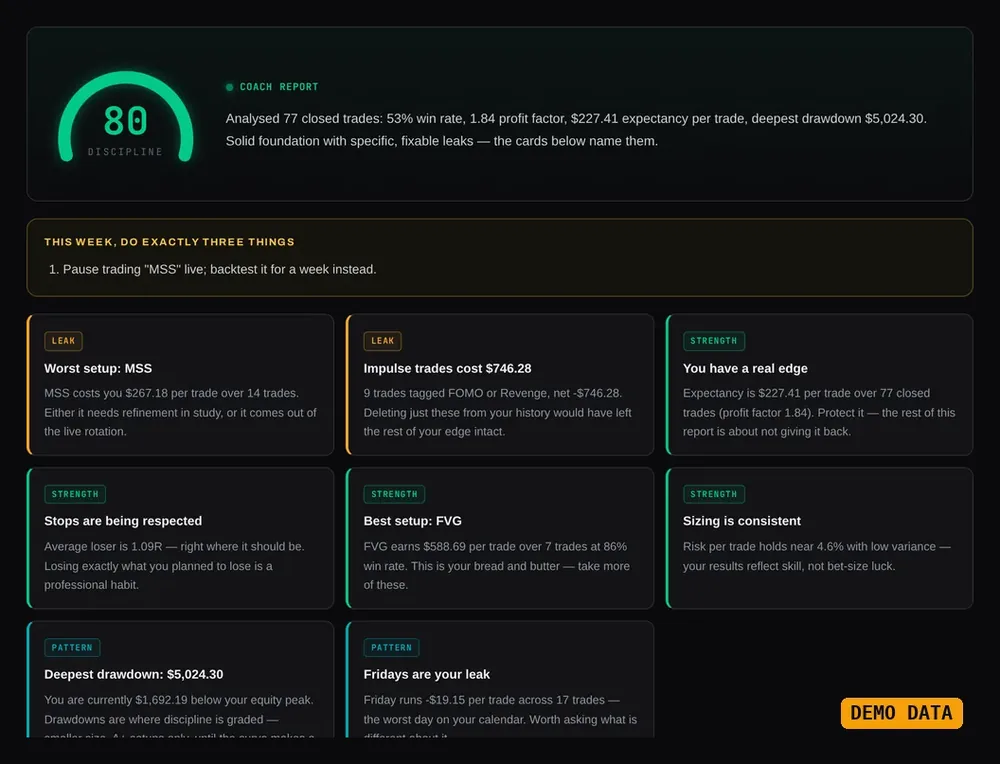
Demo data. The coach tab.
06 / 09
The coach
Rule-based checks on your own journal: expectancy, drawdown, edge by setup and session, early exits, trading after losses, overtrading, sizing and fees. Each finding is tagged fix first, leak, strength or pattern.
How it works
The checks run in your browser on your own entries. It is a fixed set of rules, not a chatbot, and your trades are not sent anywhere for it.
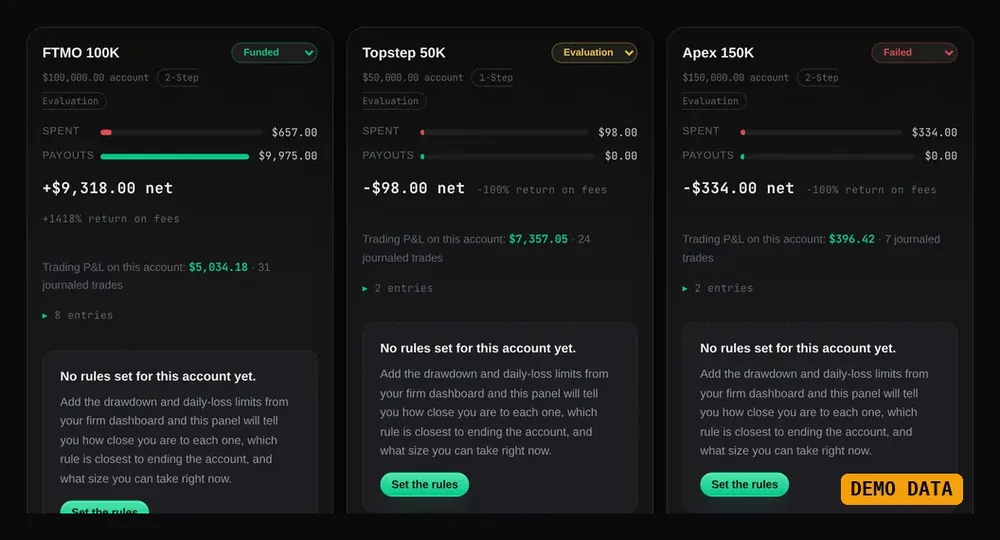
Demo data. Prop-firm account cards.
07 / 09
Prop-firm tracker
One card per evaluation or funded account: fees paid, payouts received, net result and status, so the real cost of prop trading is in one place.
How it works
Add a firm, then log fees and payouts against it. Payouts and expenses can also be imported.
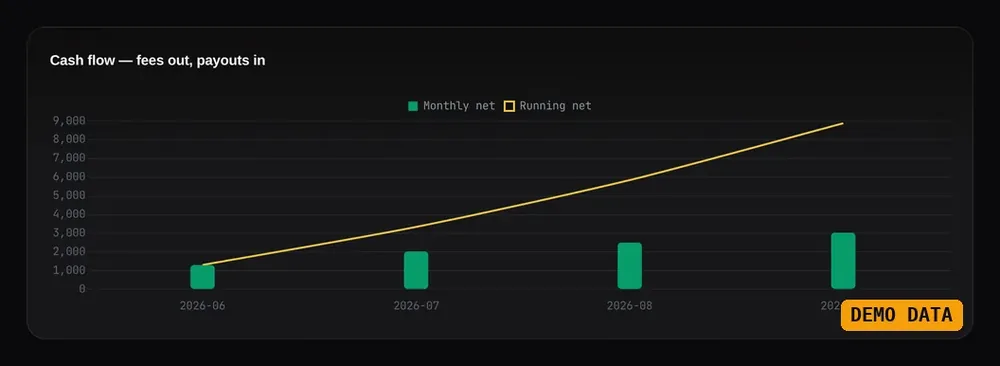
Demo data. Prop-firm cash flow.
08 / 09
Prop-firm cash flow
Fees out and payouts in, over time, across every firm you track.
How it works
Built from the fees and payouts you log on each firm card.
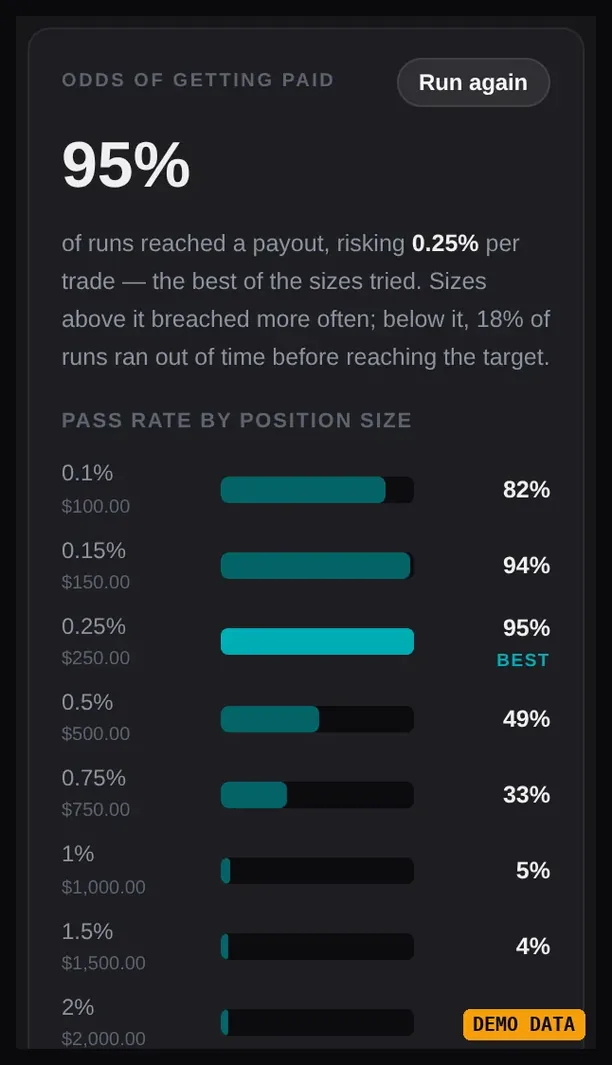
Demo data. Simulation output, not a prediction.
09 / 09
Evaluation simulator
Enter your firm’s rules and the simulator replays the evaluation many times from your own win rate and R-multiples, then shows what share of runs reached a payout at each position size.
How it works
It is a simulation of your past results against the rules, not a prediction. The panel says so itself: real losses cluster, so read the figure as an optimistic bound.
Log, review, fix
The journal is where the curriculum becomes your trading.
1
Log it
Right after the trade: instrument, model, entry, exit, stop and notes. Or import a CSV from your broker.
2
Review it
Dashboard, calendar, analytics and the coach show your patterns in your own data.
3
Fix it
Pick one leak and grade your next trades against your own rules.
How to use it
A simple routine: log each trade, review once a week. Tap a step, or let it play.
Every number on this page is demo data. Education only. Not financial advice.
Questions
Where do the numbers come from?
From the trades you log or import. The screenshots on this page use the journal’s built-in demo data.
Is the coach a chatbot?
No. It is a fixed set of rule-based checks that run on your own journal entries in your browser.
Can I import trades?
Yes. Import a CSV from your broker or another journal; the columns are matched for you and you can correct the mapping before anything is saved. Payouts and expenses can be imported too.
Does the simulator predict whether I will pass?
No. It replays your past results against your firm’s rules. It is a simulation, not a prediction, and it reads as an optimistic bound.
Can I share my results?
Yes. The journal can draw a P&L card on your device and download it as an image. Nothing is uploaded.
Start the journal habit
Create your free account and log your first trade.