See where options positioning may matter for price
SPX 7,722.72NET GEX +$1.19BIV30 12.2%ES 7,777.25SPX CALL WALL 7,800.00SPX ZERO GAMMA 7,704.52SPX PUT WALL 7,545.00NQ CALL WALL 31,080.25NQ ZERO GAMMA 30,898.84NQ PUT WALL 30,874.74
SPX 7,722.72NET GEX +$1.19BIV30 12.2%ES 7,777.25SPX CALL WALL 7,800.00SPX ZERO GAMMA 7,704.52SPX PUT WALL 7,545.00NQ CALL WALL 31,080.25NQ ZERO GAMMA 30,898.84NQ PUT WALL 30,874.74
Values shown are from a sample capture.
QQQ → NQ · 5m · 0DTE
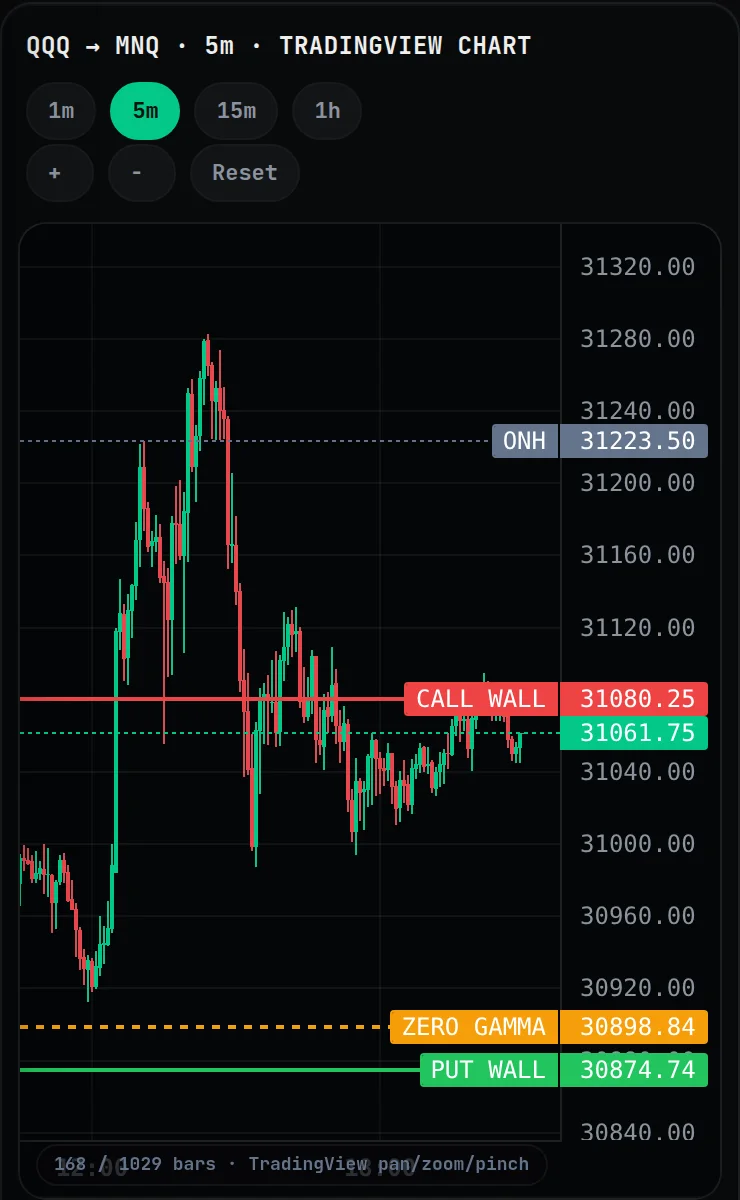
Call wall31080.25
Last31061.75
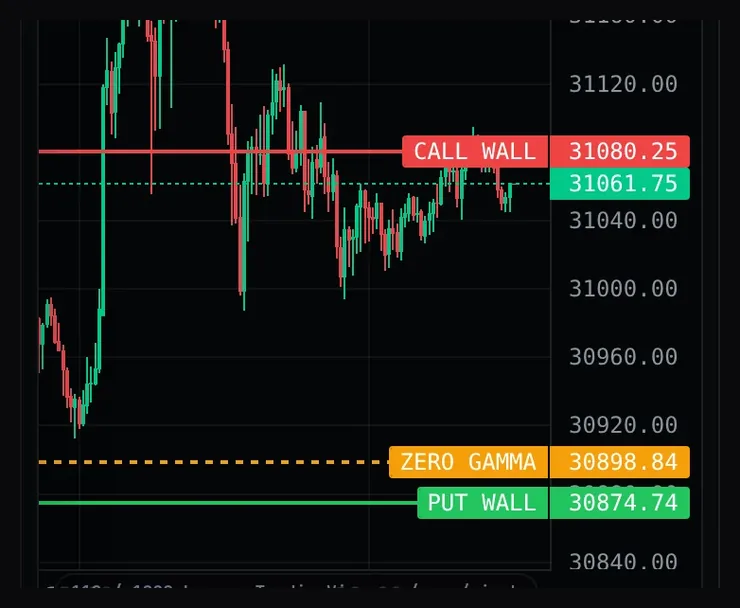
Zero gamma30898.84
Put wall30874.74
Call wall, zero gamma and put wall from QQQ 0DTE options, drawn on the Nasdaq futures 5-minute chart.
GEX turns the options chain into a handful of price levels: a call wall, a put wall and a zero-gamma line. Stryker draws them on a futures chart so you can read the session’s context before you decide anything.
Levels are context, not trade signals. Education only. Not financial advice.
What’s on the GEX page
Every item below is on the GEX page. Each one says how the number is built.
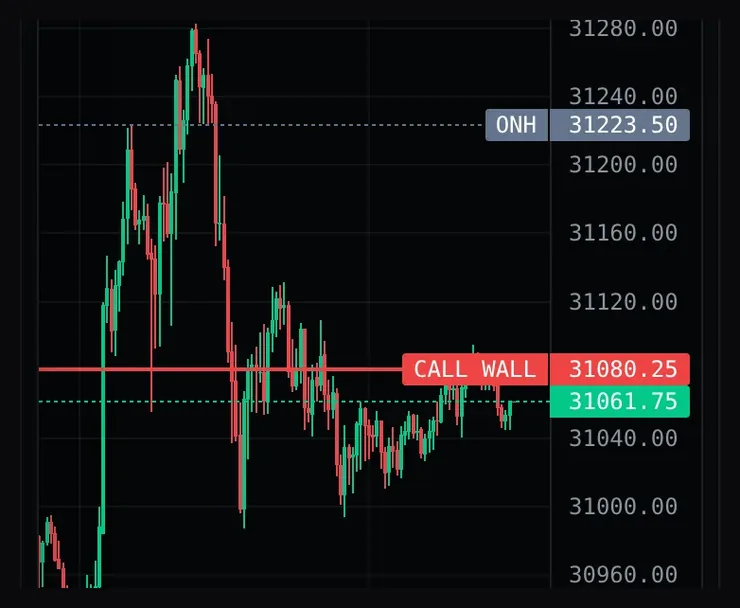
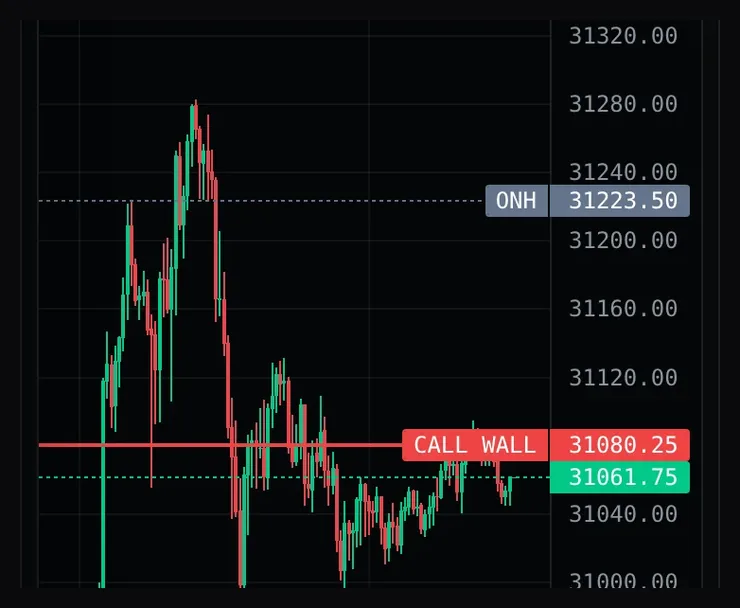
Call wall on the MNQ 5-minute chart.
01 / 12
Call wall
Call wall31080.25
The strike above price where call activity is heaviest. Often watched as an upper edge of the day’s range.
How it’s calculated
Busiest call strike at or above spot and the flip, ranked by today’s volume (open interest breaks ties), within 4% of spot. Falls back to the largest positive net GEX.
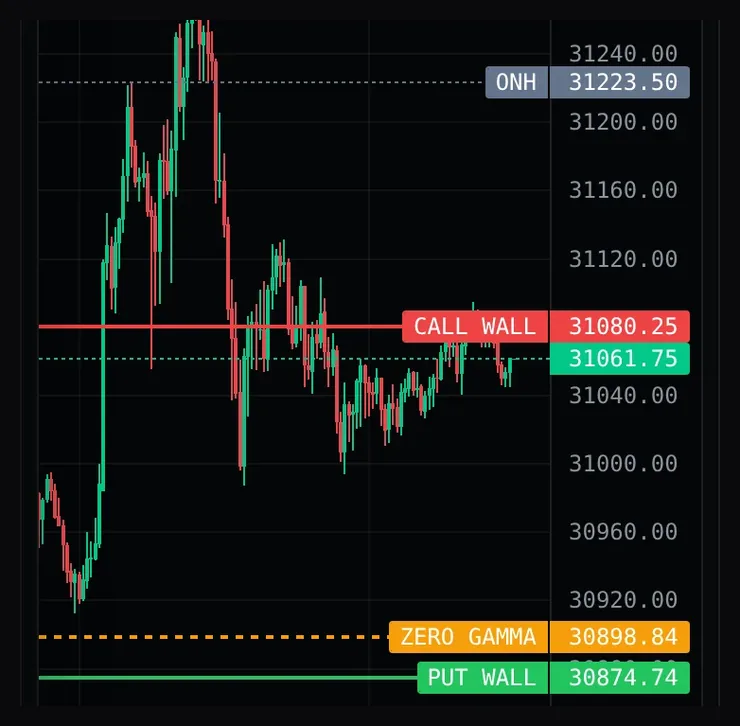
Zero gamma and put wall on the MNQ 5-minute chart.
02 / 12
Put wall
Put wall30874.74
The strike below price where put activity is heaviest. Often watched as a lower edge.
How it’s calculated
Busiest put strike at or below spot and the flip, ranked by today’s volume (open interest breaks ties), within 4% of spot.
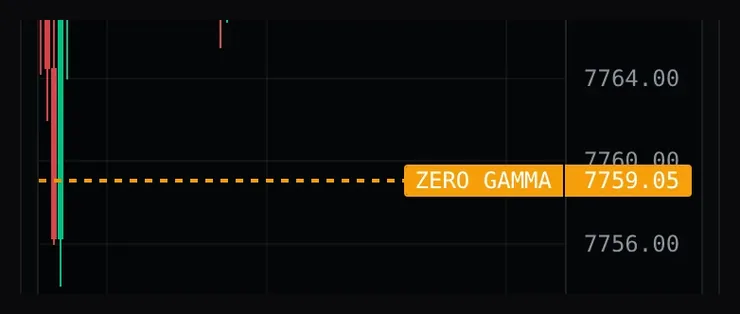
Zero-gamma line on the ES 5-minute chart.
03 / 12
Zero-gamma flip
Zero gamma7759.05
The price where the model’s net gamma changes sign, from positive to negative. Traders read it as where the model’s regime reading changes.
How it’s calculated
Net GEX is re-computed with Black-Scholes gamma on a grid from −10% to +10% of spot; the zero crossing nearest spot is shown.
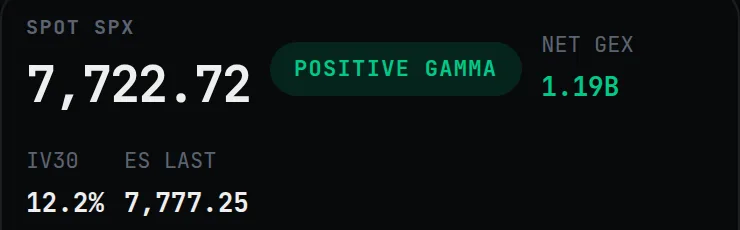
Regime panel: spot, gamma badge, net GEX, IV30.
04 / 12
Regime
Net GEX+$1.19B
A positive or negative gamma badge, plus the net GEX figure beside it. It is the headline read of the model.
How it’s calculated
The sign of summed net GEX across strikes within 6% of spot, for the expiry filter you picked.
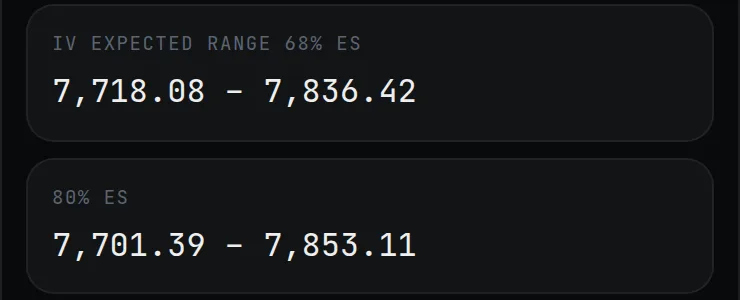
IV expected range boxes, 68% and 80%, in ES points.
05 / 12
IV expected range · 68% / 80%
68% low7,718.08
A one-day range implied by options volatility (IV30: 30-day implied volatility, how much movement options are pricing in). The 68% band is one standard deviation; the 80% band is wider.
How it’s calculated
Spot ± spot × IV30 × √(1/252) for 68%, and ×1.282 for 80%. It assumes a normal distribution of moves, so it is a statistical estimate of dispersion, not a forecast or a probability that price stays inside.
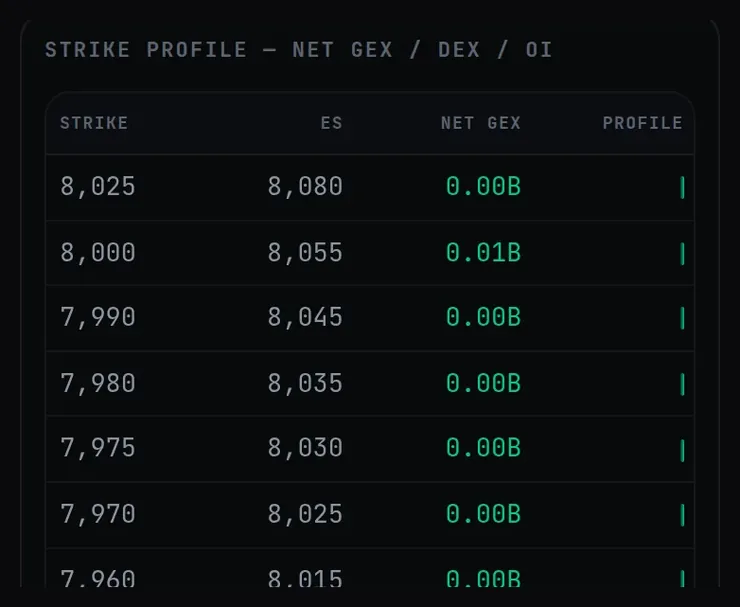
Strike ladder near spot.
06 / 12
Strike ladder · net GEX / DEX / OI
A table down the side of the page: for each strike, its net GEX, net delta exposure (DEX), open interest (contracts still open at that strike) and the matching futures price.
How it’s calculated
Strikes within 4% of spot. The profile bar scales to the largest net GEX in view.
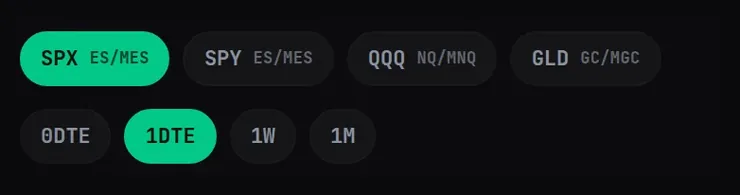
Market and expiry buttons.
07 / 12
Expiry filters
Switch between 0DTE, 1DTE, 1W and 1M. The levels re-compute for just those expiries.
How it’s calculated
0DTE uses the nearest listed expiry on its own and 1DTE uses the next one after it. 1W and 1M include every expiry within 7 or 30 days.
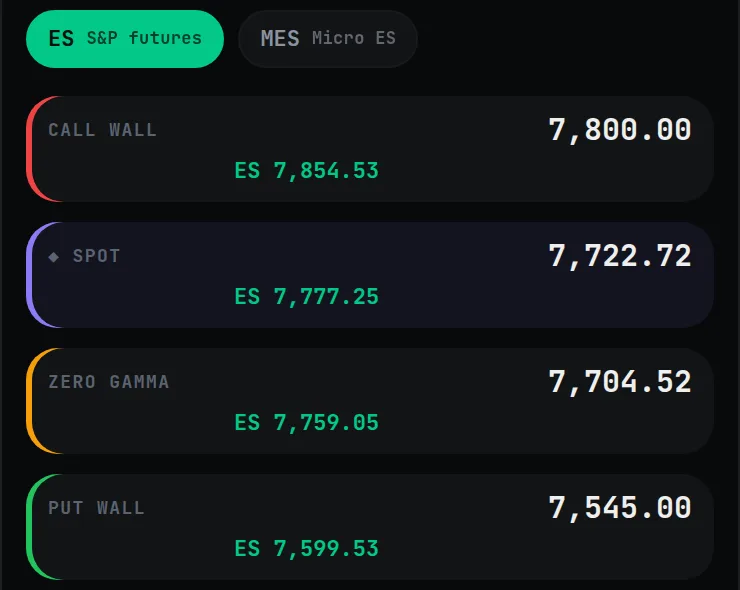
Walls panel: each level with its ES futures price.
08 / 12
Futures conversion
Call wall in ES7,854.53
Options levels are calculated on the index or ETF. Stryker converts them to the futures contracts traders chart, so a level reads in futures points. SPY (to ES/MES) is also available.
How it’s calculated
Index levels shift by the current futures basis; ETF levels use a ratio anchored to the latest futures price.
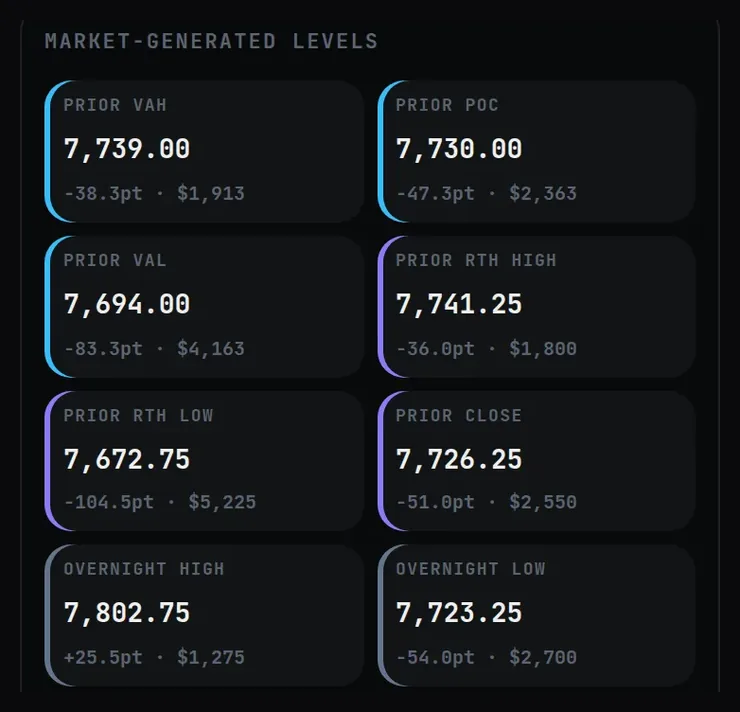
Market-generated levels card for ES.
09 / 12
Prior-day VAH · POC · VAL
Prior POC7,730.00
Yesterday’s value area high, point of control and value area low, drawn on the same chart as the gamma levels.
How it’s calculated
A 70% value area built from the prior regular session’s 5-minute futures candles, volume-weighted when volume is available.
Overnight high on the MNQ 5-minute chart.
10 / 12
Overnight high / low
ONH31223.50
The extremes made between the prior close and the next open, a common reference for where the session begins.
How it’s calculated
Highest and lowest futures price from 16:00 New York time on the prior session to 09:30 today.
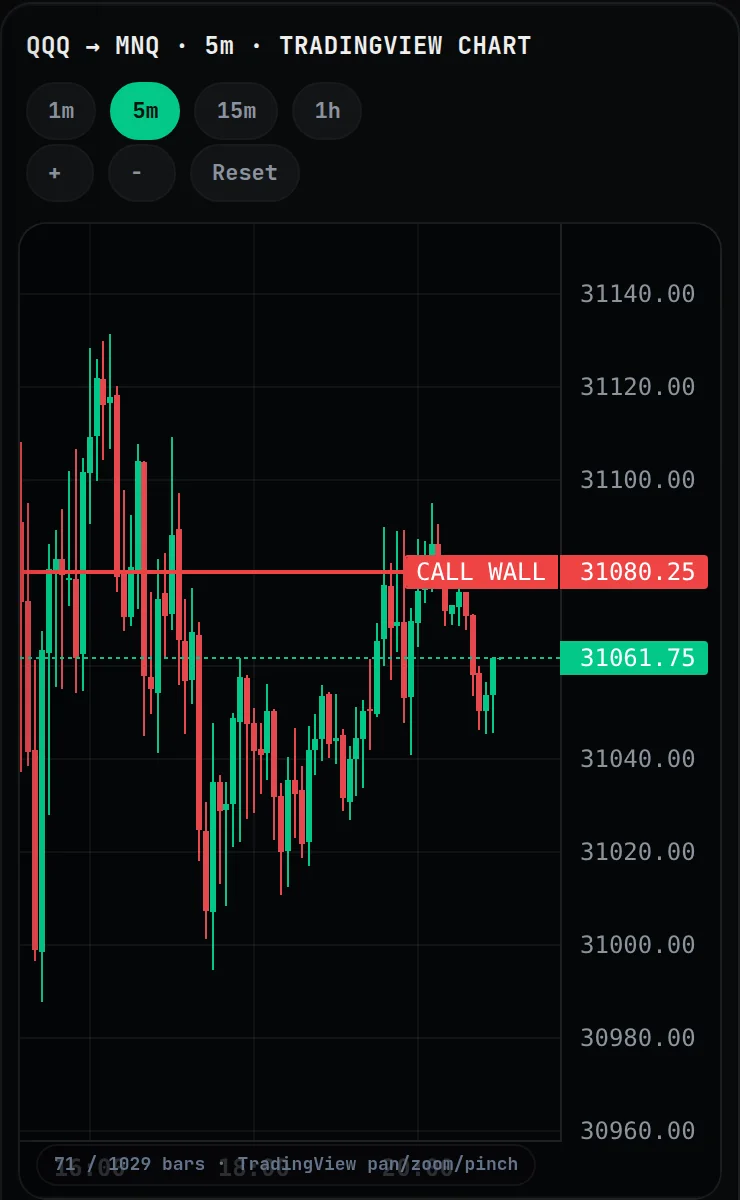
MNQ 5-minute chart with its level lines.
11 / 12
Chart with levels
A TradingView Lightweight Charts candlestick chart for the futures contract, with the walls, the flip, the IV band and the market levels drawn as lines. Switch 1m, 5m, 15m or 1h.
How it’s calculated
Candles come from the futures contract. Market levels can be switched on and off from the legend.
Chart controls: timeframes, zoom and Reset.
12 / 12
Pan and zoom on mobile
Drag to pan, pinch to zoom, or use the +, − and Reset buttons. Built to be used on a phone.
How it’s calculated
The page shows how many bars are in view, so you always know how far you have panned.
What is GEX, in plain English?
Options dealers hedge the contracts they sell. That hedging buys and sells the underlying market, and how much depends on gamma, which is how fast an option’s delta (its sensitivity to price) changes as price moves.
1
Dealers hold options risk
When traders buy and sell options, dealers end up on the other side and carry the risk.
2
They hedge as price moves
To stay balanced they trade futures or shares. The size of each hedge depends on gamma at that strike (the price an option is written at).
3
Hedging can steady or stretch
Net long gamma can dampen moves. Net short gamma can add to them. That is the regime.
POSITIVE GAMMA Possible pinning
Under the model’s assumption, dealers hedge against the move: they sell into rallies and buy dips. That can act as a brake, so some traders watch for price staying between the big strikes.
NEGATIVE GAMMA Possible amplifying
Under the same assumption, dealers hedge with the move: they buy into strength and sell into weakness. That can let moves run further than usual.
An assumption, stated plainly. Public data shows how many contracts are open at each strike, not who holds them. GEX therefore assumes dealers are long the calls and short the puts. That is a modelling convention, and it will not describe every day. Read the levels as a map of where the assumption puts the pressure, not as fact about what dealers are doing.
How traders frame a session with it
One common way to read the page, from before the open to a regime change. Tap a step, or let it play. This is education about reading the tool, not instruction to trade.
Levels are not signals. They do not say what price will do, and no level works every time.
From the options chain to the levels
The page reads Cboe’s options chain for the underlying and builds every level from it.
1
Cboe options chain
Open interest, volume, gamma, delta and implied volatility for every listed contract on the underlying.
2
Net GEX by strike
Calls count positive and puts negative, per the dealer assumption above, then are summed by strike.
3
Levels and conversion
Walls, flip, regime and IV range are derived, then converted to futures points.
4
Shown on the page
The chart, level list and strike ladder are all drawn from the same calculation.
Questions
Does GEX predict where price will go?
No. It describes how options positioning could influence hedging flows, under a stated assumption. Levels are context for reading a session, not a forecast and not a trade signal.
Why does it assume dealers are long calls and short puts?
Open interest data does not say who holds each contract. Treating calls as dealer-long and puts as dealer-short is a common modelling convention. It will be wrong on some days, so treat every level as an estimate.
Which markets does it cover?
SPX, SPY, QQQ and GLD. They convert to ES/MES, NQ/MNQ and GC/MGC futures levels (SPY maps to ES/MES).
What do 0DTE, 1DTE, 1W and 1M mean?
They filter which expiries feed the numbers: the nearest listed expiry (0DTE), the one after it (1DTE), everything within a week (1W) or within a month (1M). Each setting recalculates the walls, the flip and the ladder.
What is the IV expected range?
A one-day range derived from 30-day implied volatility: one standard deviation for the 68% band and a wider band for 80%. It estimates how much the market is pricing in, under a normal-distribution assumption. It is not where price will finish, and price can and does move outside it.
Can I use it on my phone?
Yes. The chart supports drag to pan and pinch to zoom, with +, − and Reset buttons as well.
How do I open it?
Create a free account and sign in. GEX sits in your dashboard’s sidebar. The Free plan covers SPX with the 0DTE view; Pro adds every symbol, every expiry view, the futures conversion and the strike table.
Read the options map before the open
Create a free account and open GEX from your dashboard.