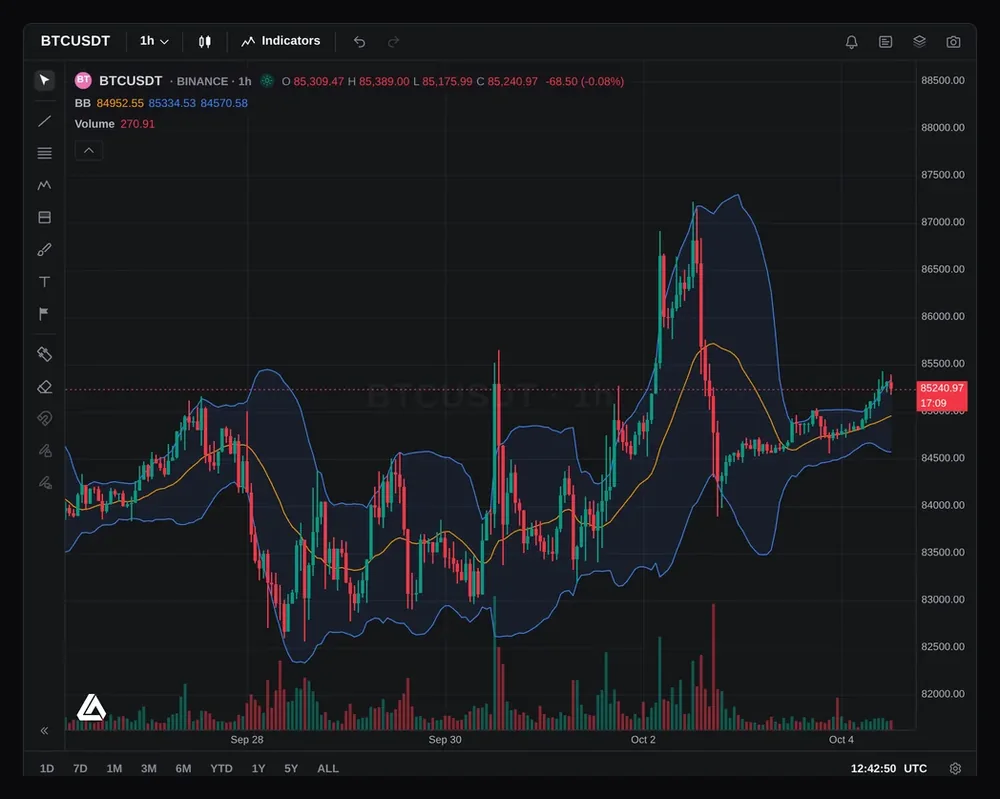
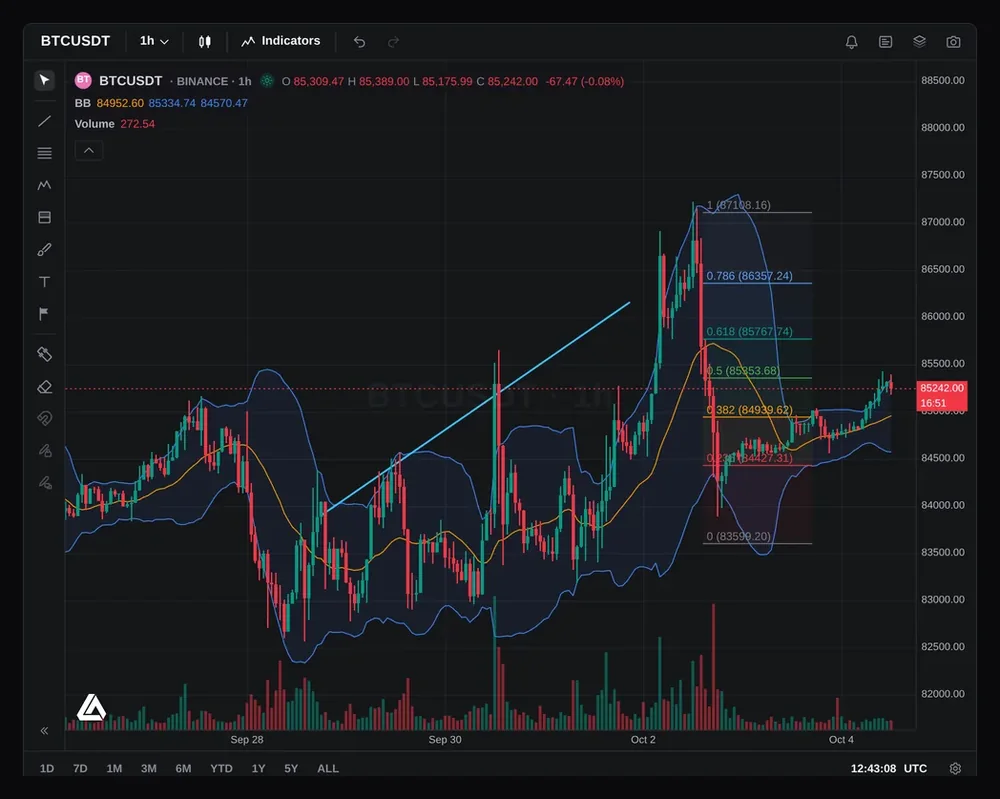
Screenshot of the workspace on BTC/USDT, one-hour candles.
Open a chart without leaving the site. Pick a crypto market and a timeframe, add indicators, draw your levels, and practise reading structure next to the lessons that taught it.
Charts are for practice and study. Education only. Not financial advice.
What’s in the charts workspace
Real screens from the workspace. Scroll through, or jump to one.
BTC/USDT, one-hour candles.
01 / 06
Candles, volume and price scale
A candlestick chart with volume, a price scale you can switch to logarithmic, and quick ranges from one day to all available history.
How it works
Switch the chart style between candles, bars, line, area, baseline and Heikin Ashi, set the time zone, and zoom or pan with the mouse, trackpad or touch.
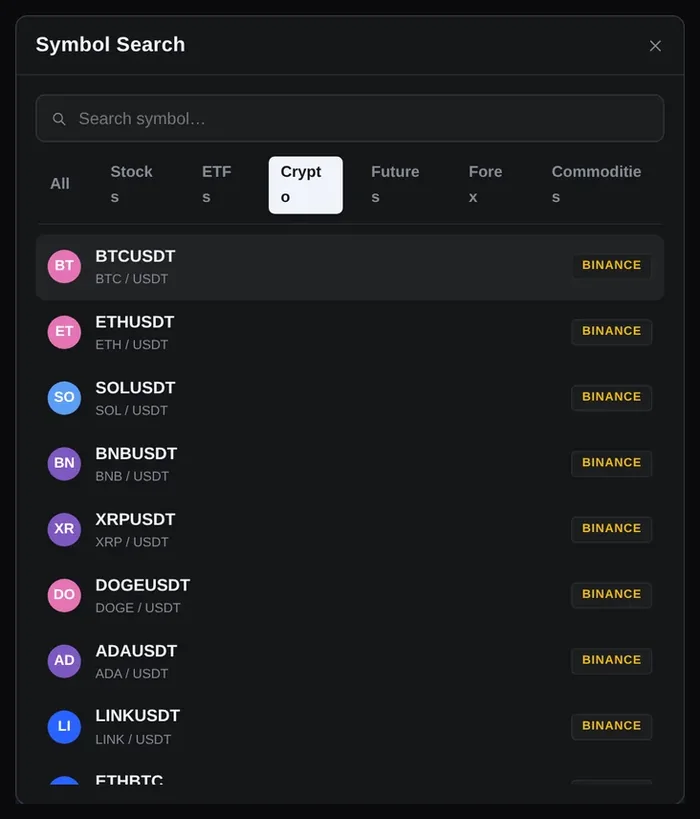
The symbol search on the crypto tab.
02 / 06
Crypto markets
Search for a crypto pair and open it on the chart. Each pair shows the exchange it comes from.
How it works
Market data comes from public Binance, Coinbase and Hyperliquid feeds and loads straight into your browser. These are crypto markets; the academy’s futures and forex practice runs in the replay tool instead.
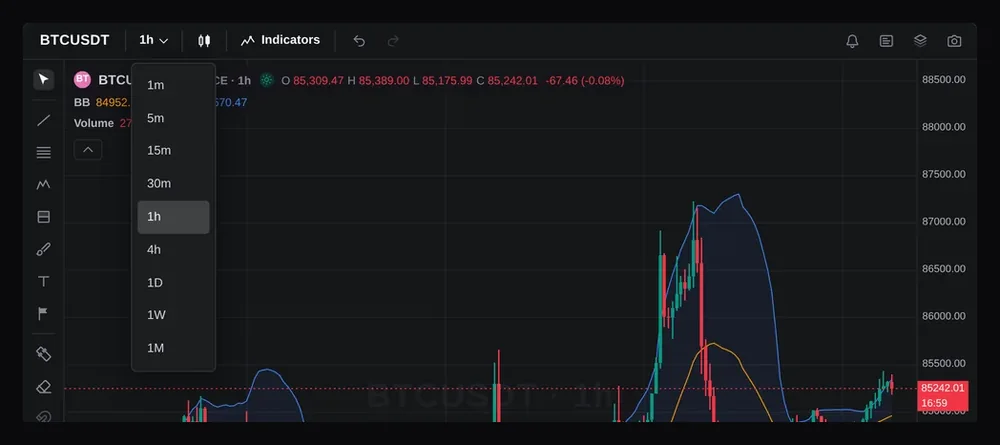
The timeframe menu.
03 / 06
Timeframes
Nine timeframes from one minute to one month, so you can move from the higher-timeframe picture down to an entry timeframe on the same market.
How it works
The chart remembers the market and timeframe you last used.
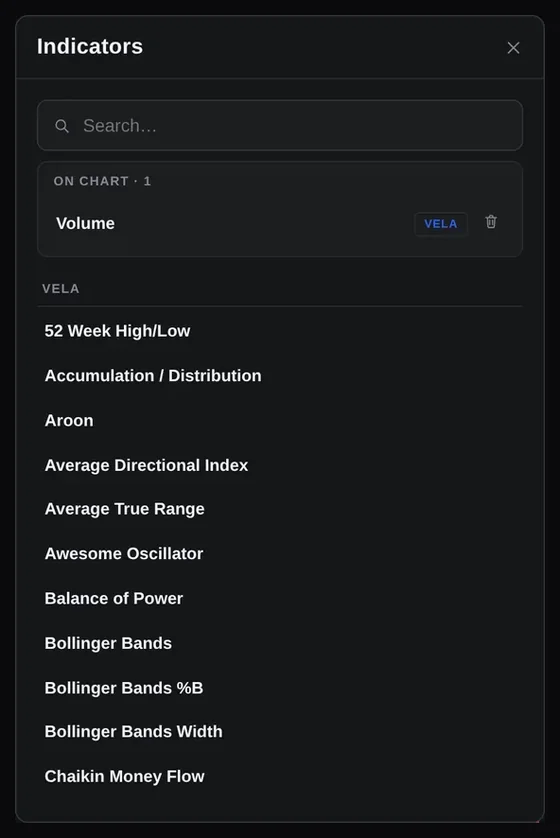
The indicators dialog.
04 / 06
70+ built-in indicators
Search and add from more than 70 built-in indicators, from moving averages, VWAP and Bollinger Bands to RSI, MACD and volume profile.
How it works
Each indicator can be configured, hidden, moved to its own pane or removed. Indicators run on the candles in your browser.
A trend line and a Fibonacci retracement drawn on the chart.
05 / 06
Drawing tools
Lines, Fibonacci tools, patterns, measurements, shapes, text and icons, with a magnet that snaps to candle prices.
How it works
Drawings stay on the chart for that market. Use the object tree to find, hide or delete them, or the eraser to clear several at once.
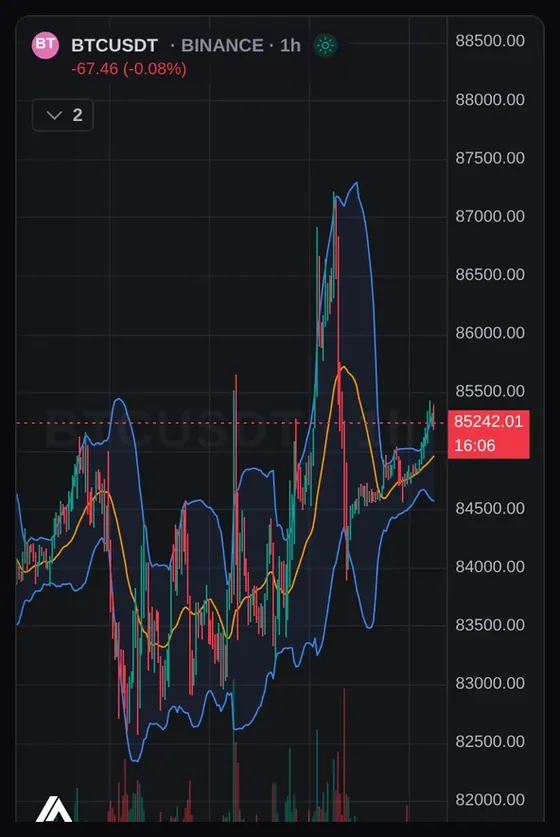
The same chart on a phone.
06 / 06
Works on a phone
Pinch to zoom and drag to pan. The chart fills the screen, with the tools a tap away.
How it works
On a small screen the toolbars collapse so the chart keeps the space.
How it works
Nothing to install and no broker account needed.
1
Open Charts
Charts sits in the Terminal section of the member area, next to the other tools.
2
Pick a market
Search a crypto pair and choose a timeframe. Candles load from public exchange feeds.
3
Make it yours
Add indicators and drawings. Your layout, drawings and indicators are saved in this browser.
One way to use it with the lessons
A simple routine for practising what a chapter teaches. Tap a step, or let it play.
Marking a chart is practice. It is not a signal to trade. Education only. Not financial advice.
Questions
Where does the data come from?
Crypto candles load from public Binance, Coinbase and Hyperliquid feeds, straight into your browser.
Can I trade from the chart?
No. The workspace is for charting and study. It is not connected to any broker and places no orders.
Which markets are there?
Crypto pairs from those exchanges, such as BTC/USDT and ETH/USDT. To practise futures and forex on past charts, use the replay tool.
Are my drawings saved?
Yes, in the browser you use. Another device or a cleared browser starts with a fresh layout.
Whose charting engine is it?
The workspace is built on Vela, an open-source charting library released under the Apache-2.0 licence.
Which plan includes it?
Charts is part of the member area. Sign in to open it.
Open a chart next to your lessons
Create your account, then open Charts from the member area.