Pick a market and a past date, and the chart stops there. Step forward bar by bar, place simulated orders with stops and targets, and see how you handle it. Every practice session then feeds a backtesting dashboard and a rule-based coach.
Every number in these screenshots comes from one demo practice session. Education only. Not financial advice.
What’s in replay and backtesting
Real screens from the tool, filled by one short demo practice session. Scroll through, or jump to one.
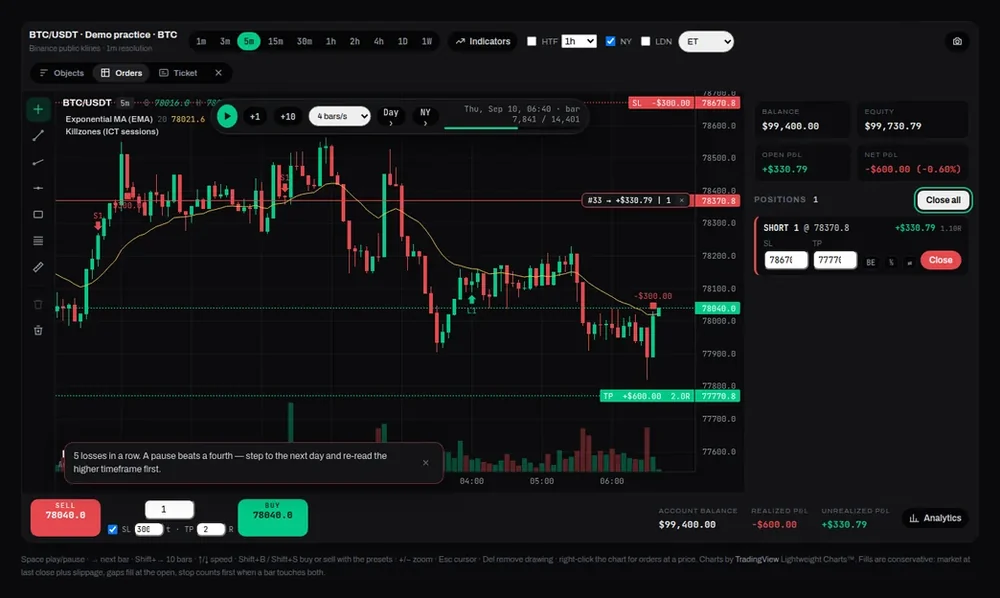
Demo data. The replay chart.
01 / 09
Bar-by-bar replay
The chart only shows what had happened up to the current bar. Play it at a chosen speed, step one or ten bars, or jump to the next day or the New York open.
How it works
Choose a market, a start date and a window of one week to a few months. Futures, forex and crypto candles are loaded once and kept in your browser, or you can load your own CSV file. Switch timeframes from 1 minute up to weekly, and add a higher-timeframe chart beside it.
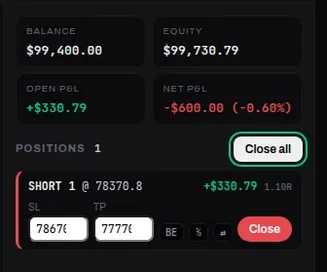
Demo data. The practice account and an open position.
02 / 09
Simulated orders
Buy or sell from the chart, the order ticket or the keyboard. Attach a stop and a target, move them, or close part of a position. The practice account tracks balance, equity and open P&L as you step.
How it works
Fills follow simple rules: market orders fill at the last close plus any slippage you set, gaps fill at the open, and if one bar touches both your stop and your target the stop counts first. Commission per contract can be set per session. Real fills can differ.
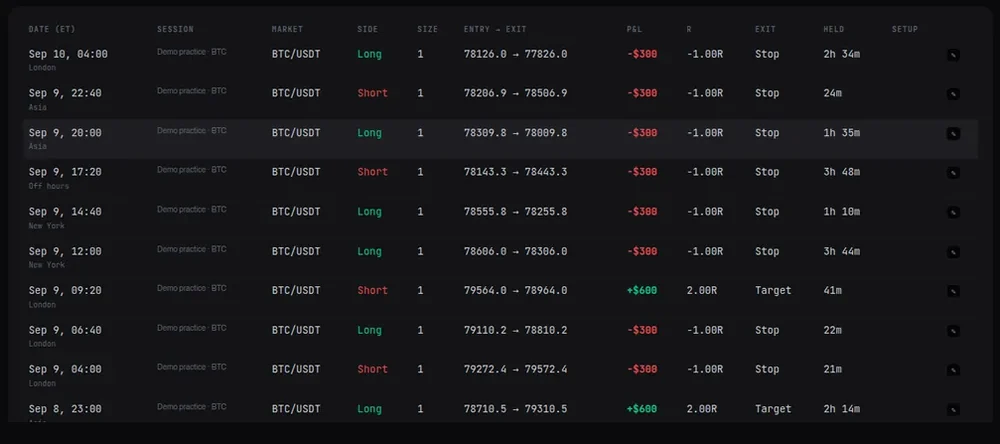
Demo data. Trades from the practice session.
03 / 09
Every trade, logged
Each closed practice trade is listed with its session, side, size, entry and exit, R-multiple and why it closed. Tag the setup and any mistake, and add a note.
How it works
Filter by market, side, outcome, session, setup, weekday, hour or date. Trades can be exported to CSV or copied into your trade journal.
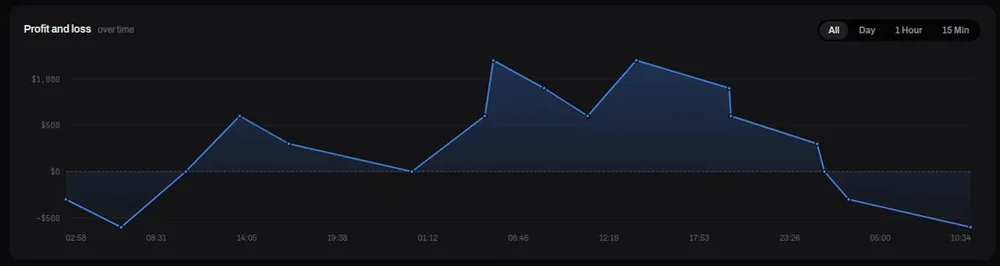
Demo data. Practice P&L over time.
04 / 09
Backtesting dashboard
One dashboard across all your practice sessions: P&L over time, win and loss breakdowns, performance by side and by trading session, recent sessions and a P&L calendar.
How it works
Sessions are saved in your browser as you go, with a copy on your account so you can resume on another device.
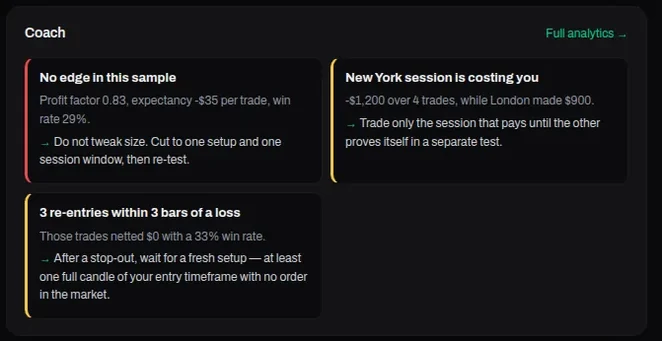
Demo data. Coach findings on the practice session.
05 / 09
The replay coach
Rule-based checks on your own practice trades: losing streaks, overtrading, re-entries straight after a loss, which session costs you, and your most frequent tagged mistake. Each finding comes with a suggestion to consider.
How it works
It is a fixed set of rules that runs in your browser on your own trades. It is not a chatbot and nothing is sent anywhere for it. While you trade it can also show a short nudge, for example after several losses in a row.
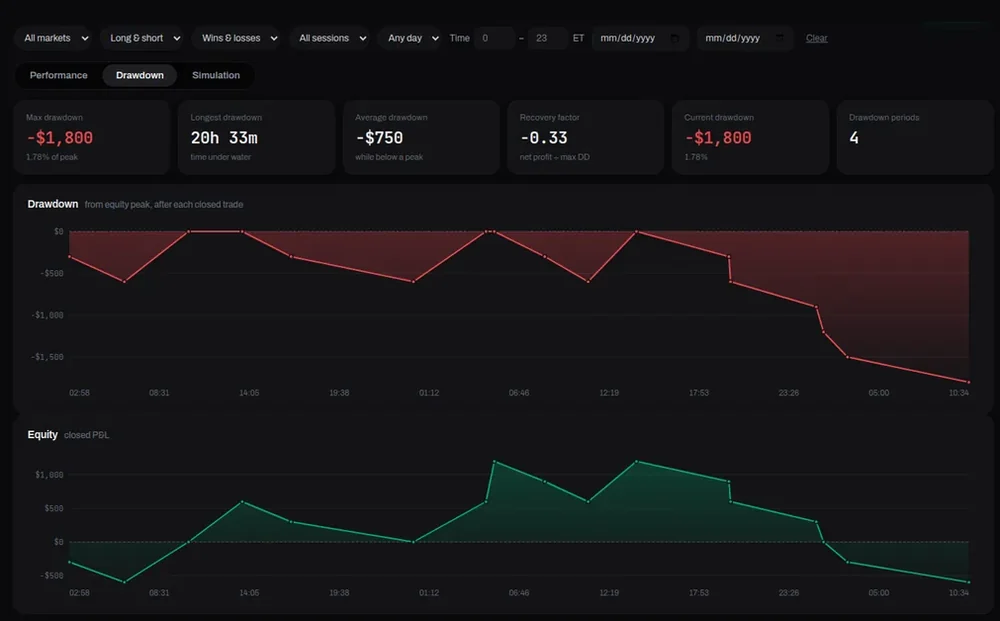
Demo data. Drawdown and equity for the practice session.
06 / 09
Drawdown and equity
How deep and how long your practice equity fell from its high, next to the equity curve itself.
How it works
Drawn from closed practice trades and the starting balance you chose for each session.
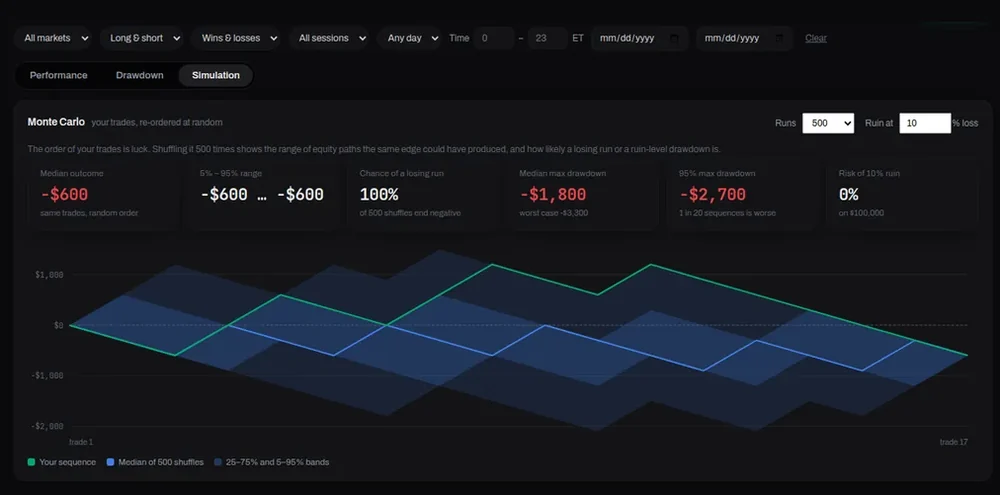
Demo data. Simulation output, not a forecast.
07 / 09
Trade-order simulation
Shuffles the order of your practice trades many times to show how much the same trades could have swung in a different sequence.
How it’s calculated
It re-orders the trades you already took. It does not create new trades and it is not a forecast: a small sample, like the one here, says very little.
Demo data. Long against short.
08 / 09
Breakdowns
Split your practice trades by side, session, hour, weekday, setup tag, market and exit reason, and see where the R-multiples cluster.
How it works
Every chart uses the same filters as the trades table.
Demo data. A saved practice session.
09 / 09
Saved sessions
Every session keeps its place, drawings, indicators and orders, so you can stop and resume where you left off.
How it works
Rename, resume or delete sessions from the Sessions view.
Set up, replay, review
A practice session takes a few minutes to start.
1
Set it up
Pick a market, a start date, a window and a starting balance. Optionally choose a playbook so its rules become your pre-trade checklist.
2
Replay it
Step through the chart and practise as if it were happening, with the future hidden.
3
Review it
Open the backtesting dashboard: trades, analytics and the coach, built from what you just did.
One way to practise a model
A simple routine for drilling one setup. Tap a step, or let it play.
Practice results are not trading results. A replay cannot reproduce real fills, nerves or news. Education only. Not financial advice.
Questions
Is replay trading real?
No. Orders are simulated against historical candles in your browser. No money and no broker are involved.
Can I see the future candles?
No. The chart stops at the current bar and only moves forward when you step or press play.
Which markets can I replay?
Futures such as NQ, MNQ, ES, MES, YM, RTY, GC and CL, major forex pairs, and BTC, ETH, SOL and XRP against USDT. You can also load your own CSV file of candles.
Is the coach a chatbot?
No. It is a fixed set of rule-based checks that run on your own practice trades in your browser.
Does a good backtest mean the setup works?
No. Practice results are not trading results, and a small sample says very little. Use replay to drill execution and to test whether you follow your own rules.
Which plan includes it?
Free members get 3 backtesting sessions a week. Pro is unlimited, with replay and the full analytics.
Practise before you risk anything
Create your free account and start a replay session.